
01
SCANNABLE PRINT TECHNOLOGIES:
UNDERSTANDING CONSUMER PERSPECTIVE USING THE
TECHNOLOGY ACCEPTANCE MODEL
JANET CHEUNG
ABSTRACT
Technology has evolved immensely over the years. Namely, the widespread adoption of the internet and smartphone devices has had an immense impact on the way that society receives and digests information (Asare & Asare, 2015). According to Statista, smartphone users have exceeded three billion and are expected to grow by several hundred million in the coming years (Holst, 2019). To adapt to this reality, scannable print technologies have emerged and many industries — including packaging — have adopted the advancement.
To adhere to rapid technology developments, scannable print technologies have expanded to reach various mediums, primarily in forms of quick-response codes, augmented reality, and near-field communication tags. While they all fall under the umbrella term of scannable technologies, they are all tasked with diverse roles and when used as marketing tools, may be beneficial or harmful under different circumstances.
This thesis aimed to use a mixed method research approach to better understand the opportunities and challenges of scannable print technologies. Further, conclusions were drawn to determine what should be considered when using these technologies as a marketing tool for product packaging.
LITERATURE REVIEW
The Oxford Dictionary defines packaging as “materials used to wrap or protect goods” (Lexico, 2020). Packaging has evolved to become more than just a covering for a product; it has expanded to act as a marketing tool by using different elements to communicate a brand and push consumer purchases. As there are many products on the shelf fighting for customer interaction, brands have only a few seconds to catch customer attention (Silayoi & Speece, 2007). Research shows that consumer attraction is significantly affected by package design, shape, colour, and size (Alhamdi, 2020). Consequently, it is critical to use these elements to design effective product packaging that persuades the customer to choose your product above all others.
The package becomes the symbol that communicates favorable or unfavorable implied meaning about the product. Underwood et al. (2001) suggest that consumers are more likely to spontaneously imagine aspects of how a product looks, tastes, feels, smells, or sounds while viewing product pictures on the package (Silayoi & Speece, 2007, p. 1497).
While this concept may come across routine, designers must consider the different segments of consumers and their target demographic to create something realistic for the marketplace (Silayoi & Speece, 2007). As previously mentioned, packaging should also adhere to the foundational definition as there is no use in creating a visually pleasing package if it does not contain and protect the product within.
SCANNABLE PRINT TECHNOLOGIES: QR CODES, AR, AND NFC TAGS
Over the years, scannable print technologies have been gradually integrated into global marketing strategies in the form of printed codes—such as Quick-Response (QR) codes, Augmented Reality (AR), and Near-Field Communication (NFC) Tags—which can be read by smartphone devices to increase consumer interaction.
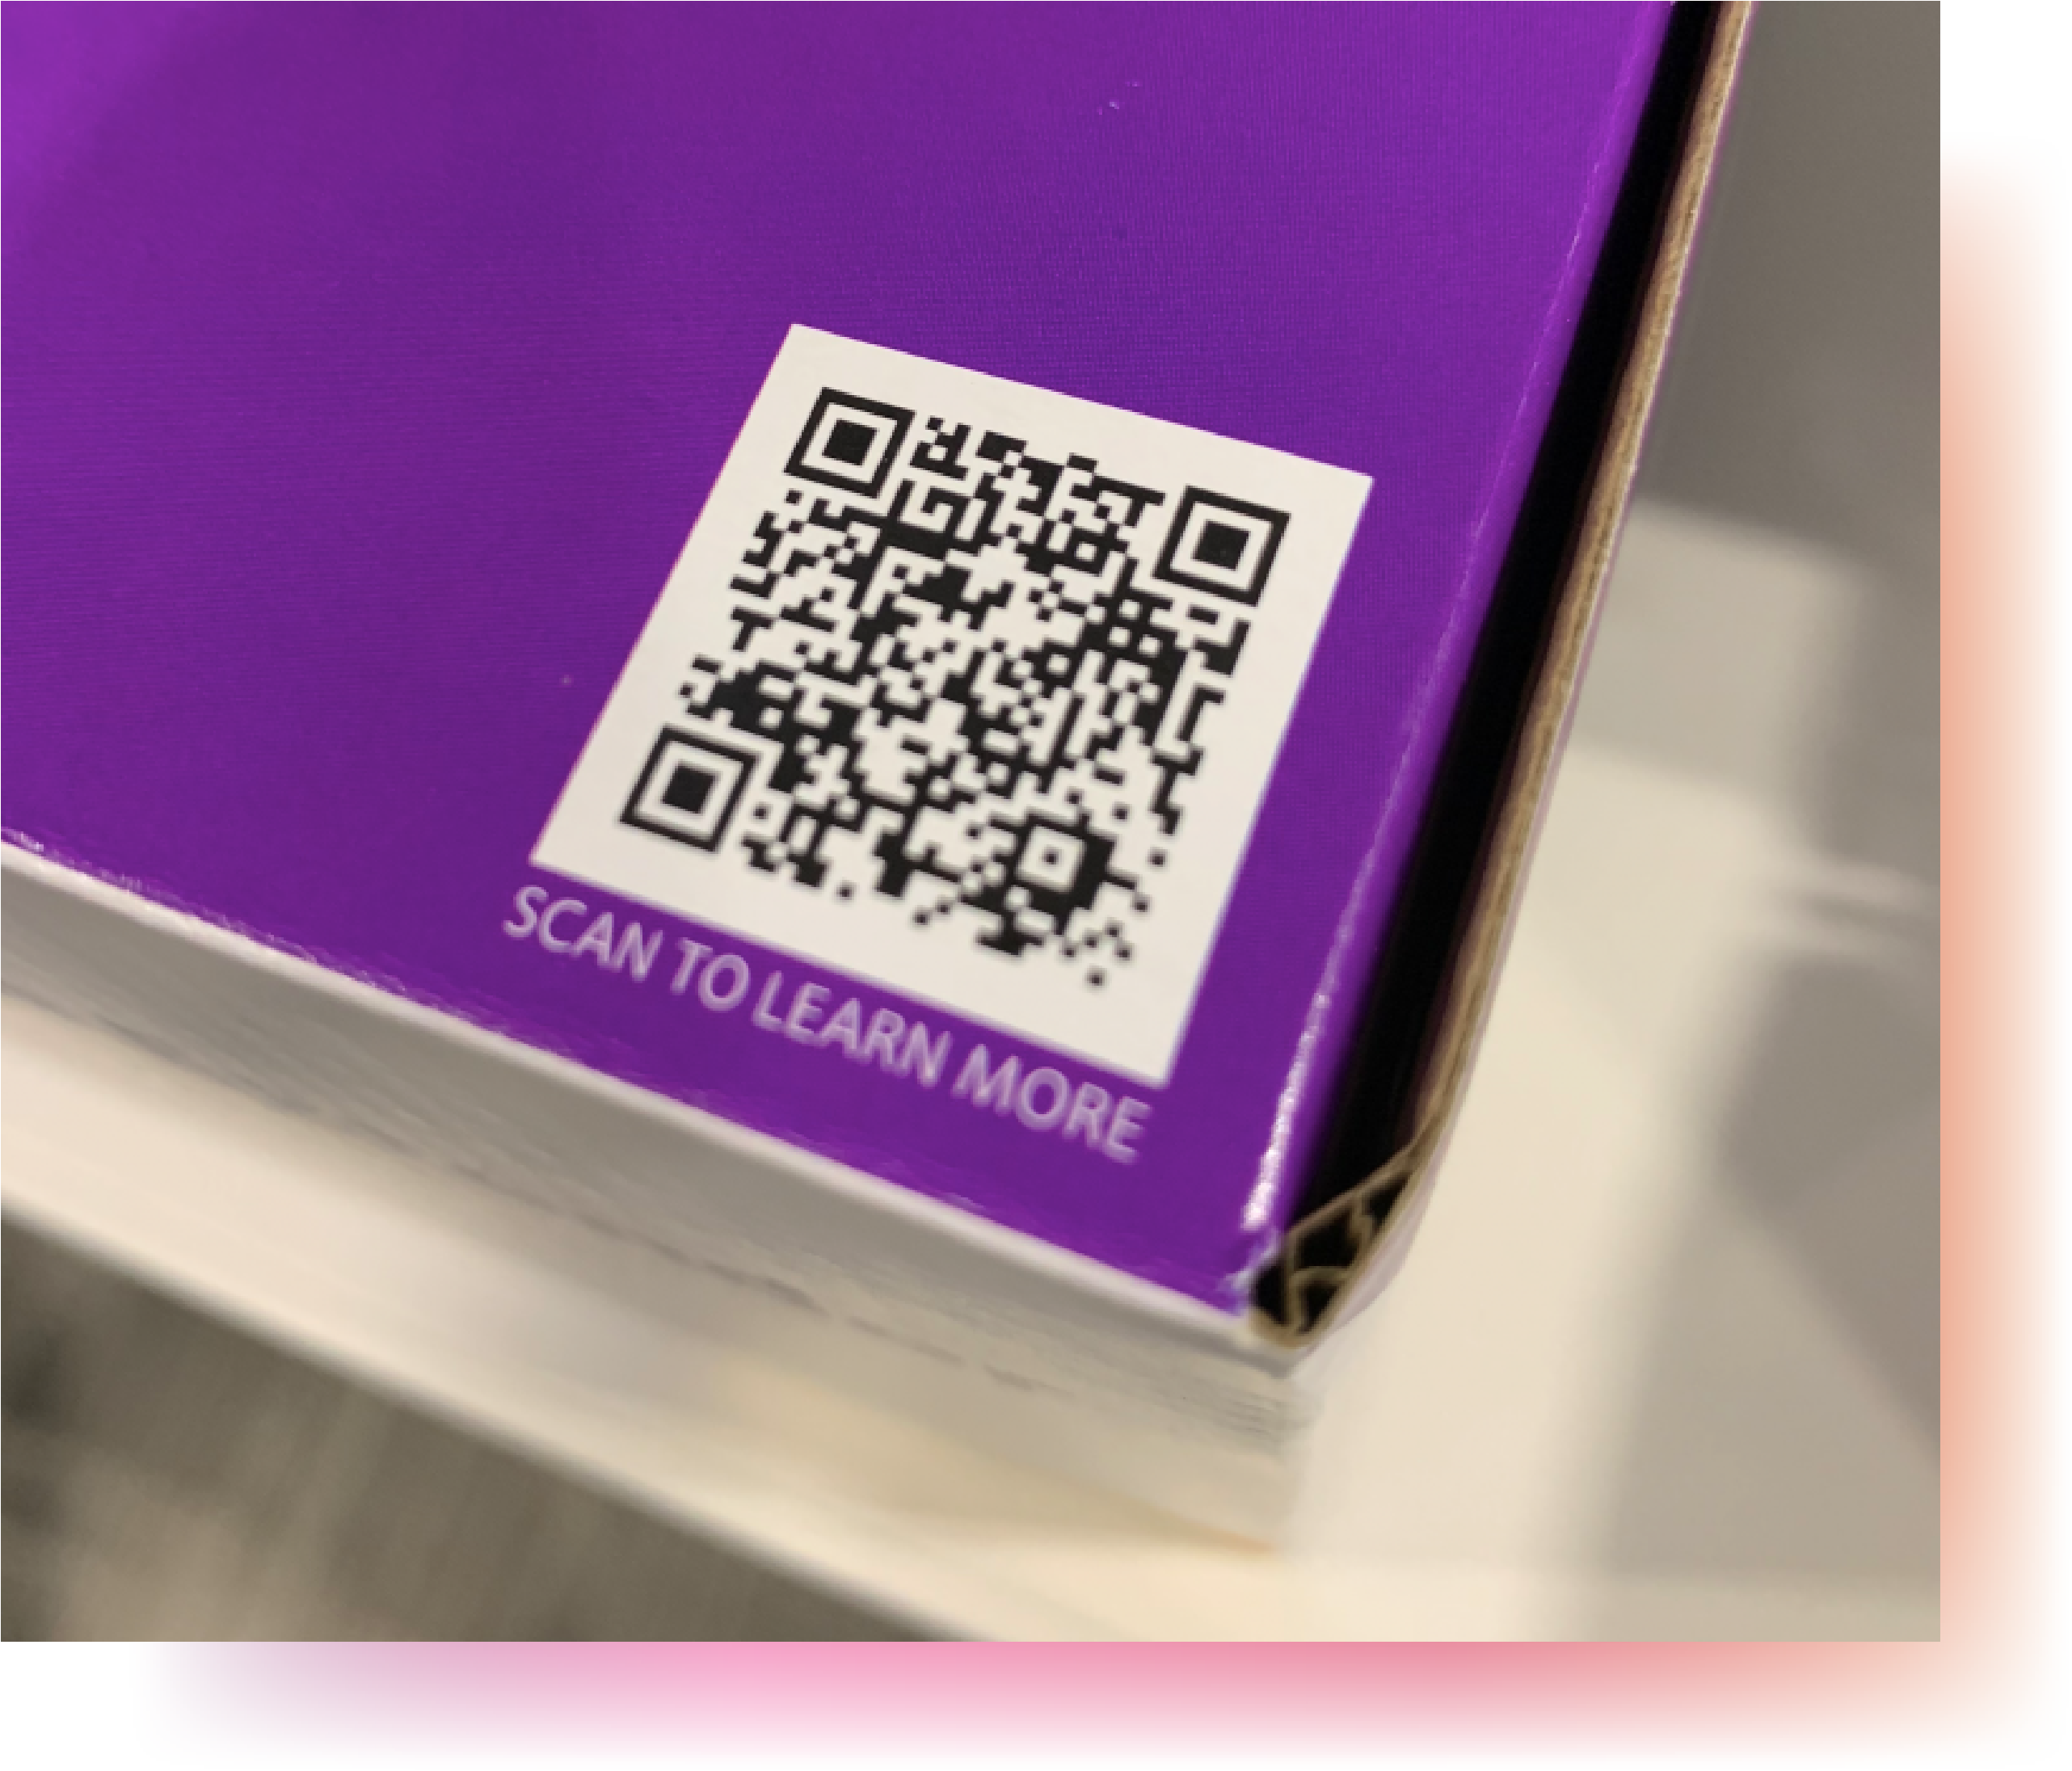
Figure 1. QR Code
QR codes are an evolution of the UPC code, which is a linear symbol consisting of thirteen numerical digits. While UPC codes are still used today, their primary use is for pricing and inventory operations (Soon, 2008). QR codes are two-dimensional, meaning information can be read vertically and horizontally. This allows for approximately one hundred times more information to be contained in the symbol, but the information is read quickly nonetheless – hence the name, “Quick Response” code (Soon, 2008). These printed codes can be scanned using mobile devices to guide the consumer to online and offline digital content, such as a website, app download, image, text file, and many others (Okazaki et al., 2012). By allowing consumers with the ability to interact with products at their leisure, “QR codes have changed [the] traditional PUSH model of communication to the PULL model where the receiver is able to interact and engage with a brand” (Fortin & Surovaya, 2018, p. 359). While there seems to be much potential for this technology, it has not been widely adopted by companies and consumersalike (Watson et al., 2013).
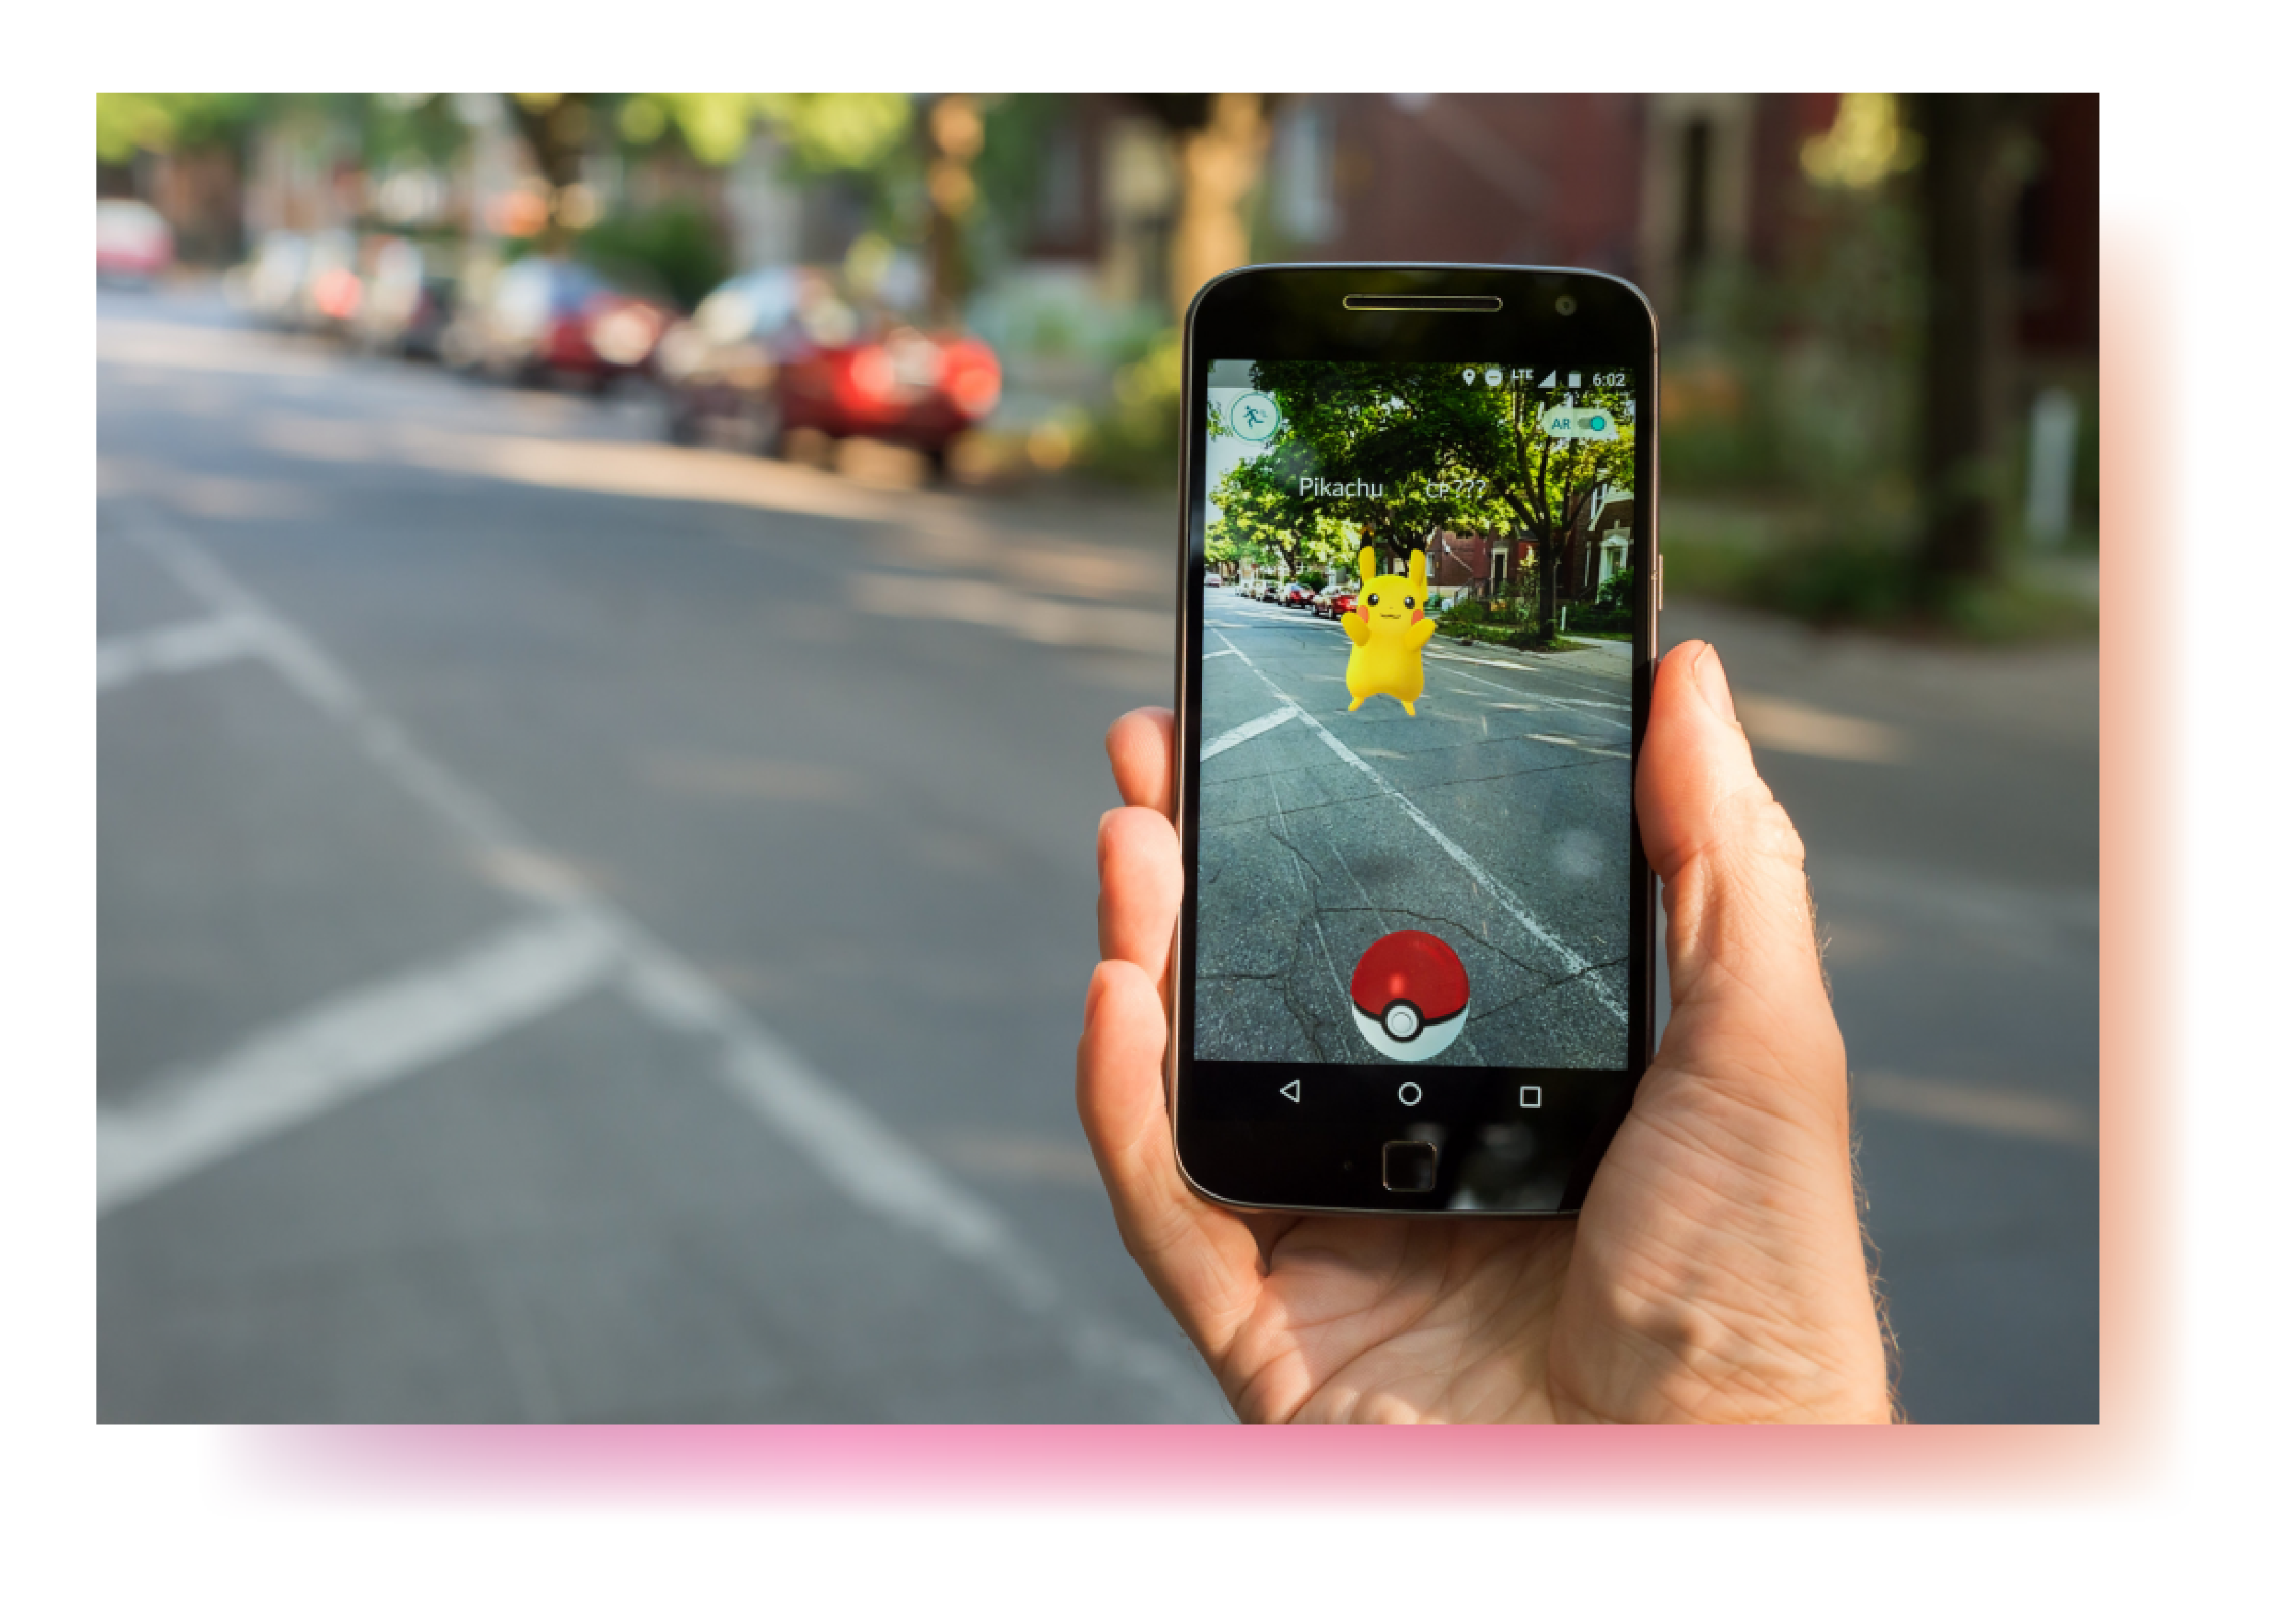
Figure 2. Augmented Reality Using Smartphones
Augmented reality is another form of scannable technology that has become widely available to smartphone users in recent years. “With an augmented reality system, we become part of the computer environment, rather than just an external, detached observer with limited interaction” (Peddie, 2017, p. 2). By using computers, such as smartphones, AR allows viewers to see on-screen images interact with tangible objects in real life. As a result, the on-screen images are aligned with tangible objects in real time, effectively making it seem as though both items are coexisting in the real world (Van Krevelen & Poelman, 2010). Unlike Virtual Reality technology, AR allows users to remain aware of their physical surroundings while virtually interacting with digitally-seen objects. (Van Krevelen & Poelman, 2010). This relatively new technology has allowed businesses to generate new product development and packaging ideas. According to PTC, in 2018 augmented reality became a “top business imperative” for companies that wanted their brand to compete in the digital world (Campbell et al., 2019).
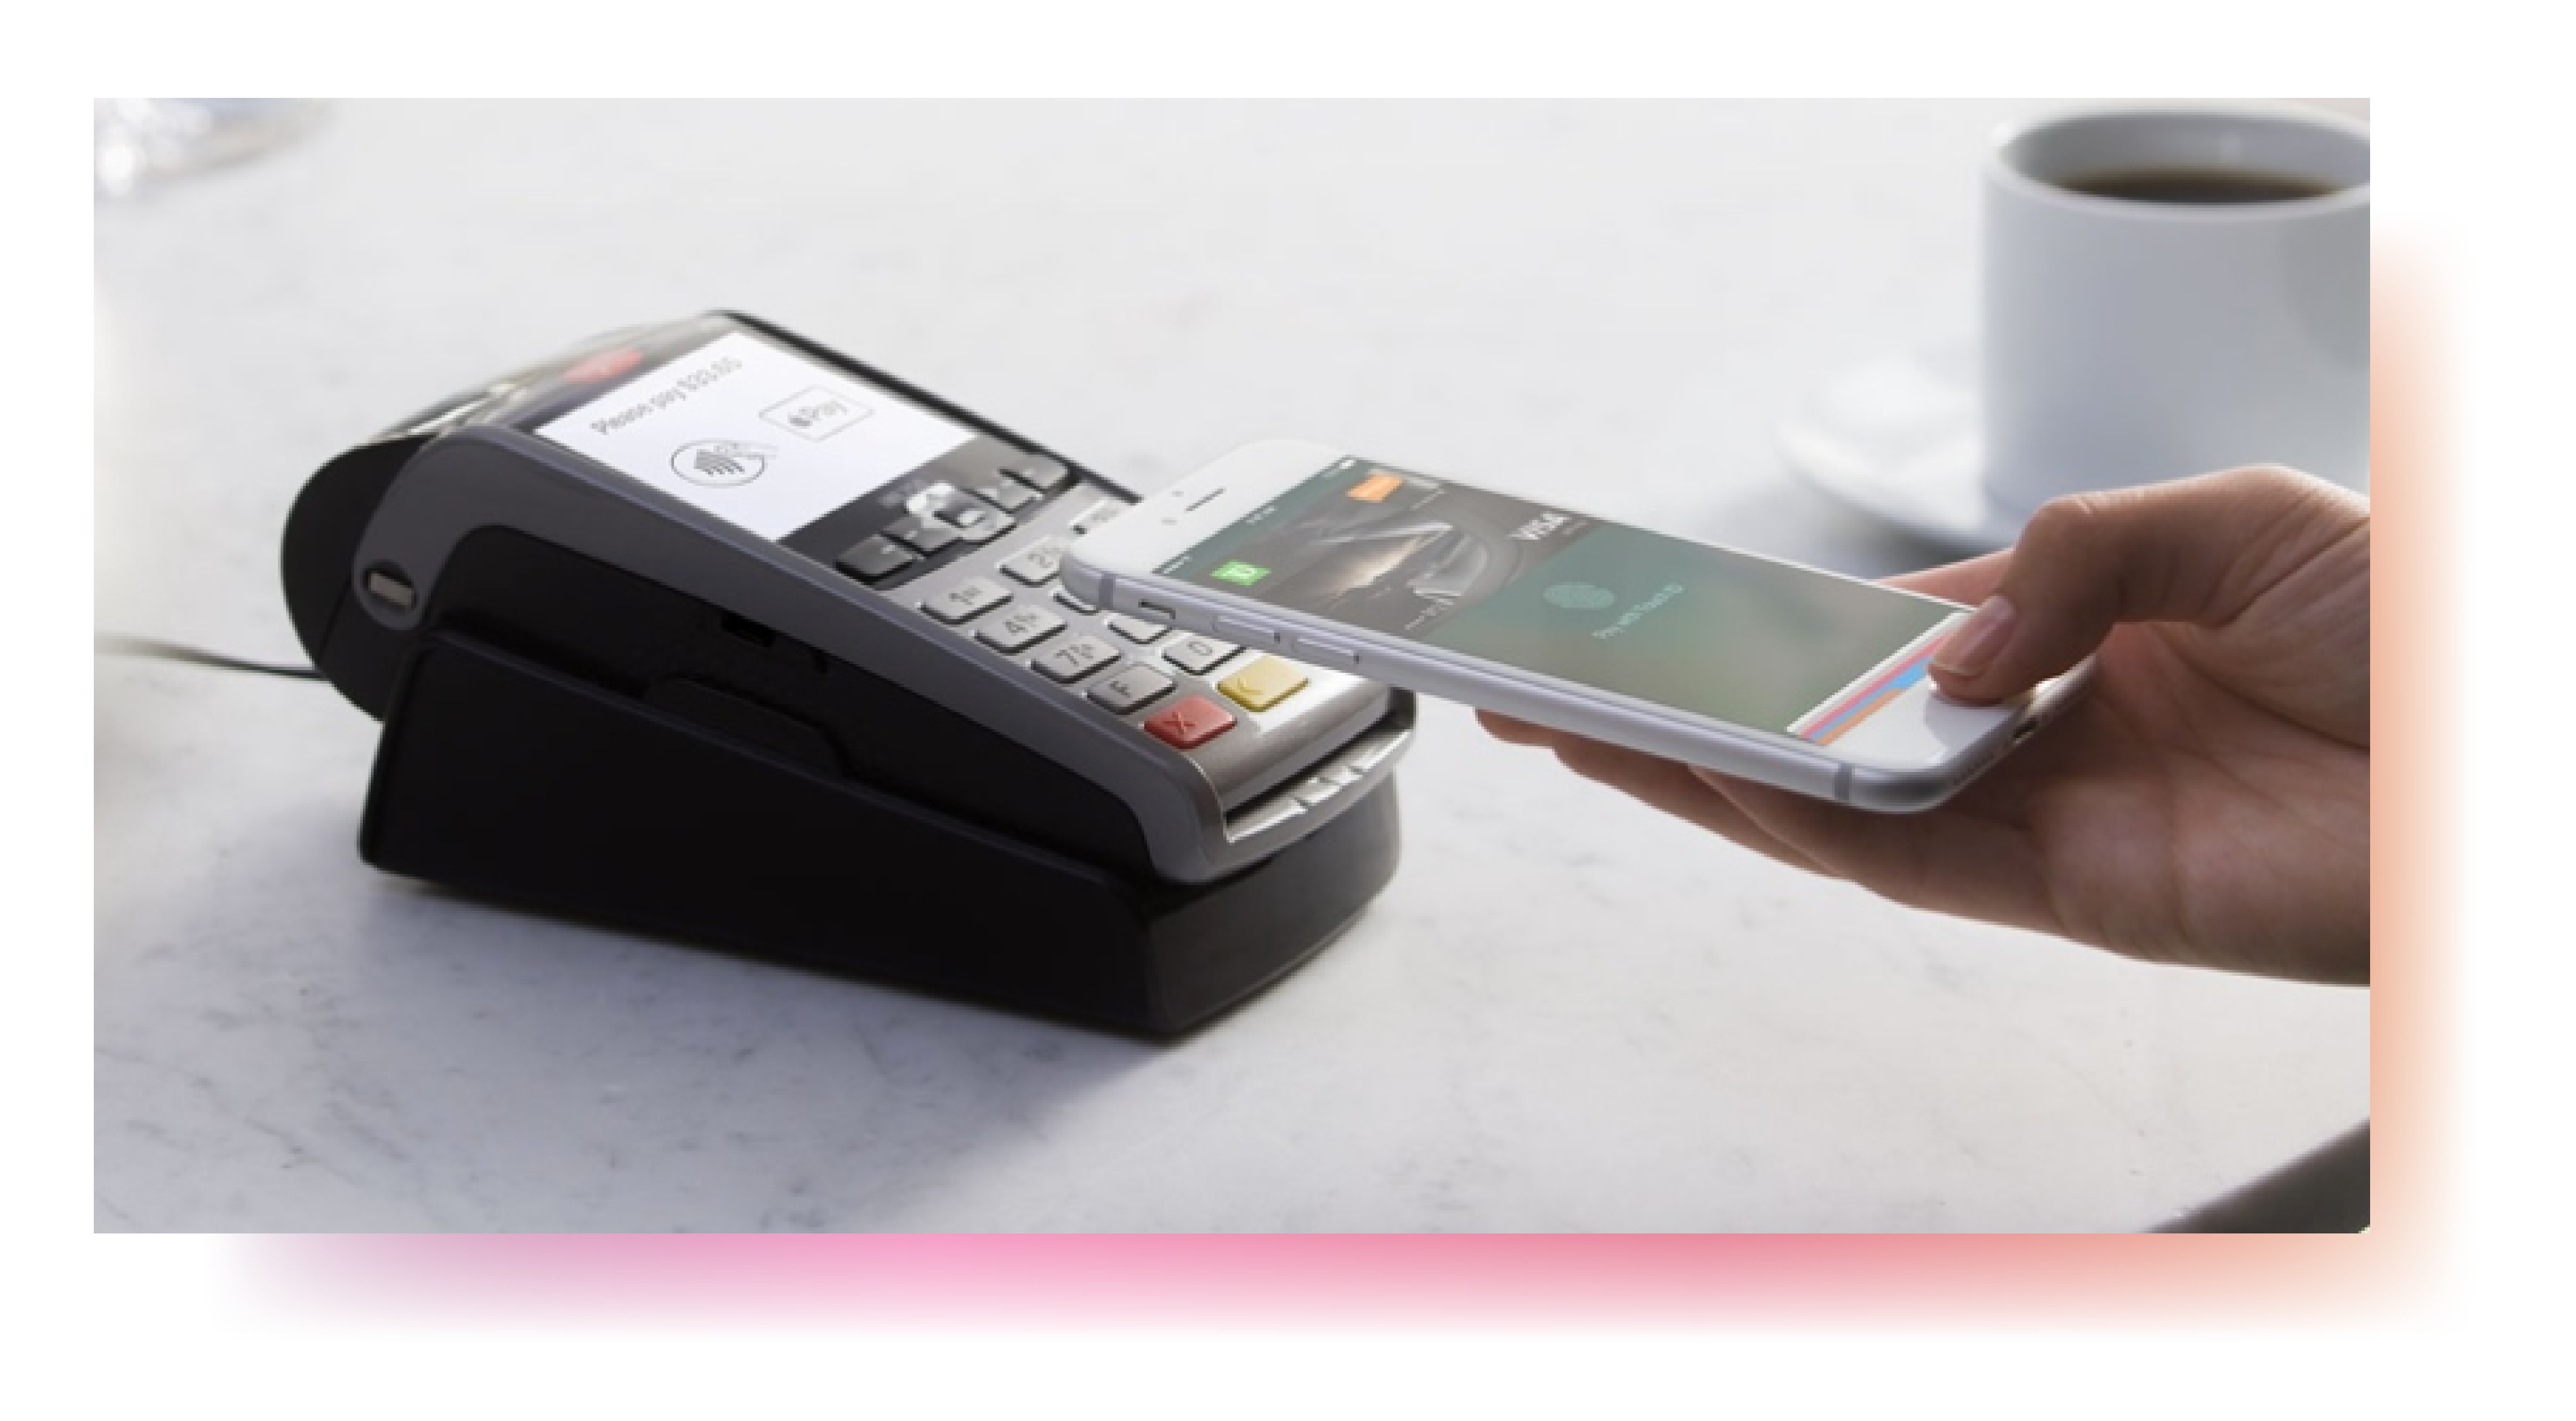
Figure 3. Digital Wallet Being Used for Payment
Finally, near-field communication tags are scannable technologies that have changed the way many systems operate, including payment, navigation, and more (Coskun et al., 2015). NFC tags are an evolution of radio-frequency identification (RFID) tags that allow “short-range wireless communication” between two terminal points (Coskun et al., 2015, p.13348). In short, data is exchanged between two technologies, and this can be applied in whatever way the business sees fit. For example, users may build digital wallets on their phones and trigger payment upon tapping their phones on a card reader, or video game players may load characters onto their accounts by touching a character card to their controller. Due to its short-distance communication range, NFC provides a secure and protected means of transmitting information (Coskun, et al., 2015). Only three devices are used for NFC communication: smartphones, NFC tags, and NFC readers; even so, the wide ranging versatility and flexibility ofthese devices allows NFC technology to be applied in increasingly innovative environments (Coskun et al., 2015).
Businesses should take advantage of opportunities to engage and attract customers. The more time customers spend investigating a product, the more likely they are to purchase it (intelliFLEX et al., n.d.). By using scannable print technologies, value is added to packaging that consumers would otherwise discard once the product inside was used. However, the difficulty is getting consumers to change their mindset toward this type of technology; overcoming this would allow for further innovation and smarter implementation (intelliFLEX et al., n.d.).
TECHNOLOGY ACCEPTANCE MODEL AS A FRAMEWORK
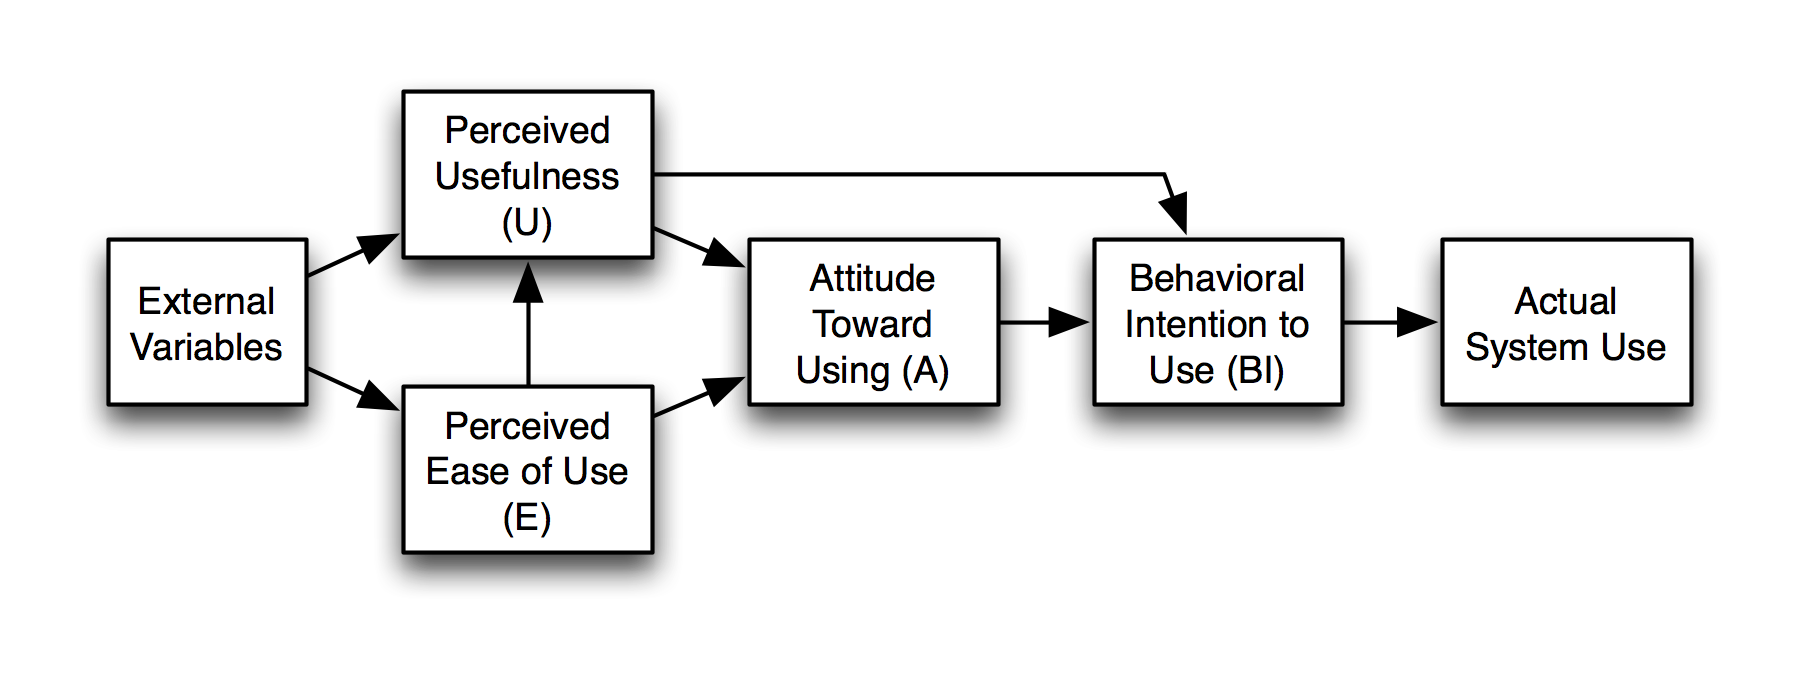
The findings in this paper were guided by the Technology Acceptance Model (TAM). As the adoption of scannable print packaging remains unclear in Western culture, this model helped explain the reasons why past campaigns concluded. Further, it supported survey results. TAM was introduced in 1986 by Fred Davis and is defined as one of the “most influential and commonly employed theor[ies] for describing an individual’s acceptance of information systems” (Lee et al., 2003, p. 752). Composed of six components, this model stands out due to the two belief constructs: Perceived Usefulness (PU) and Perceived Ease of Use (PEOU).
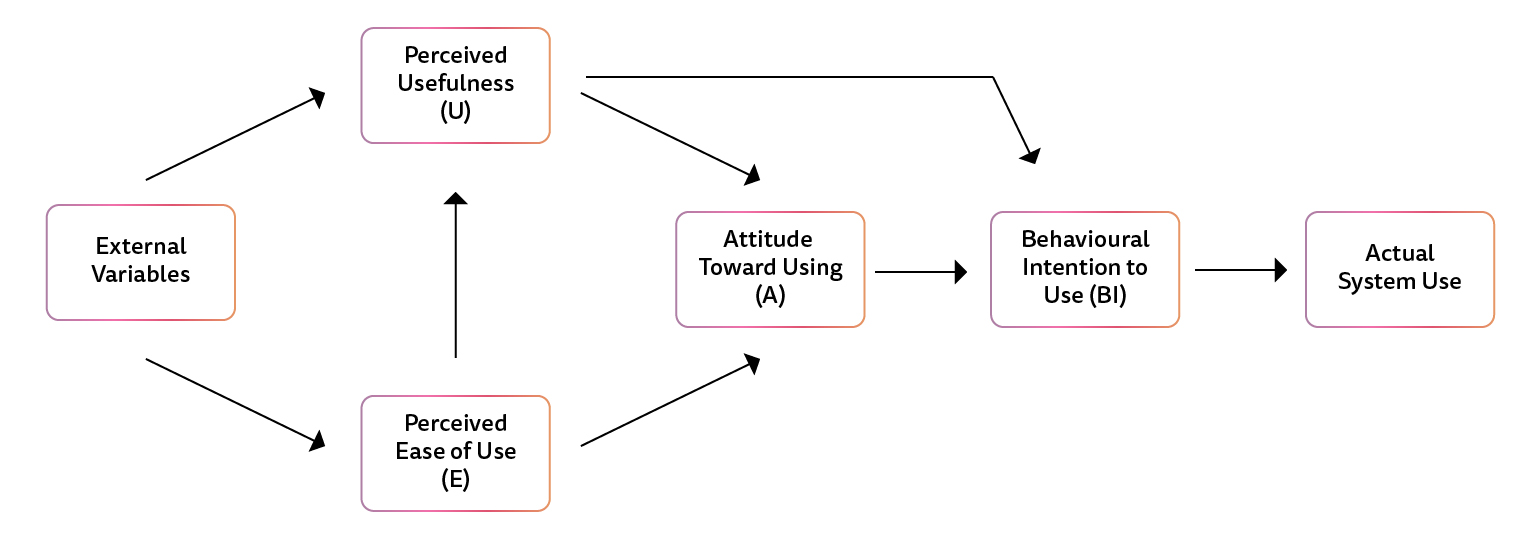 Figure 4. Technology Acceptance Model
While Perceived Usefulness and Perceived Ease of Use may be analyzed as independent variables within the Technology Acceptance Model, it is known that PEOU may greatly impact the results of PU. Usefulness improves if users already believe that the technology is easy to use (Erasmus et al., 2015).
It is important to note that TAM says little about technology itself and more about ourselves as consumers; the model is subjective because results shift depending on the audience interacting with the technology. In other words, even if the technology is useful and easy to use, how we perceive it will affect its rating in this model (Lee et al., 2003). Additionally, this model was originally developed to define acceptance of technology in a workplace (Lee et al., 2003); however, it may also be applied to acceptance within society for consumers, which is how this paper utilized this model. Overall findings relied on the twelve items, as developed by Davis (Sauro, 2019). For the purpose of this paper, these items provided the framework to decide the overall consensus for perceived usefulness and perceived ease of use. The twelve items were slightly adjusted to better adhere to the topic of accepting scannable print.
Usefulness Items:
- Using scannable print enables me to accomplish my tasks more quickly.
- Using scannable print improves my performance.
- Using scannable print increases my productivity.
- Using scannable print enhances my effectiveness.
- Using scannable print makes life easier.
- I find scannable print useful.
Ease of Use Items:
- Learning to operate scannable print is easy for me.
- I find it easy to get scannable print to do what I want it to do.
- My interaction with scannable print is clear and understandable.
- I find scannable print to be flexible to interact with.
- It is easy for me to become skillful at using scannable print.
- I find scannable print easy to use.
METHODOLOGY
A mixed methods research approach was employed to gain insights into how the audience perceived scannable print. This type of approach uses multiple strategies to collect both quantitative and qualitative data; it aims to answer research questions from both perspectives to highlight different aspects and allow for an overall better understanding of a topic (Creswell, 2003). For the purpose of this paper, two methods were used to gain insights about using scannable print on packaging as a marketing strategy: (1) a social media review and (2) an online survey open to the public. The two methods occurred separately, but concurrently. Given that users are the sole audience of interactive scannable print on consumer packaging, it is imperative to understand their perspective when determining how to successfully implement the technology in the marketplace.
1. SOCIAL MEDIA REVIEW
To gain a wider view of public opinion on scannable print technologies, a social media review was conducted. Three campaigns that used these technologies were compared; each campaign’s respective hashtag was searched for on Twitter, and the resulting top twenty-five tweets (i.e., search results) were recorded. Each tweet was then analyzed to determine the user’s view of the campaign or the use of scannable technology (positive, negative, or neutral), and whether the tweet explicitly discussed the use of scannable print. Analyzing the search results provided deeper insights into the performance of each campaign and the part that scannable technology played.
Twitter is a widely used platform, ranking as the 6th most used social media in the world with over 300 thousand active monthly users in 2020 (Kallas, 2020). Consequently, search results may have ranged immensely depending on which of these users decided to share about these campaigns; opinions may have been tweeted by early adopters and laggards alike. Moreover, a relatively small sample of tweets was collected, which provided a limited range of the opinions available online. This was due to the short time frame allotted to conduct this research, as it would have proved difficult to sort through a larger sample. The results were viewed as objectively as possible, but biases may be present as some tweets may not have explicitly discussed the campaign or scannable print in a positive or negative light. In addition, scannable print may not have held a main role in the campaign; rather, it may simply have been a supporting element. Finally, results found may not have been a direct consequence of the scannable print on the packaged product.
The three campaigns analyzed were Cadbury’s #JoyOfANewKind, Amazon’s #SmileCodes, and Coca-Cola’s #WannaSprite.
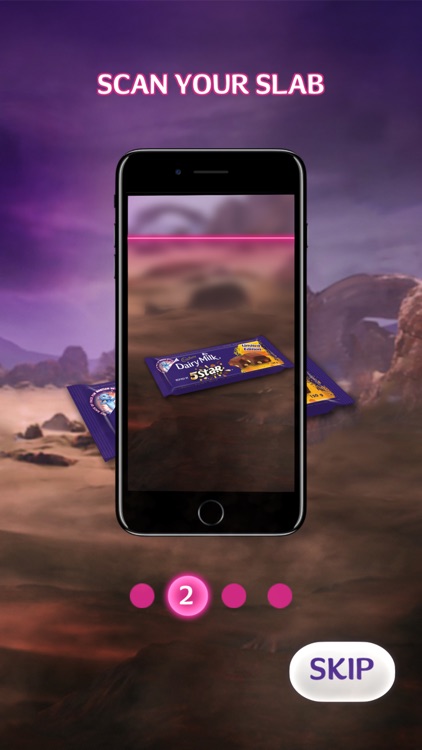
Cadbury’s #JoyOfANewKind campaign was launched in South Africa in 2018 to promote their four new martian figurines, which were each paired with a unique chocolate bar flavour. The campaign was available in participating stores from the beginning of June to the end of August 2018. By purchasing these chocolate bars, consumers were able to scan the wrapper using a smartphone and collect stickers to eventually redeem a martian at participating petrol stations. The digital images showed the martians dancing and interacting with one another to help the characters come to life. In addition, augmented reality was implemented using promotional stations strategically placed in stores and spots of public gathering (i.e., shopping centres) to boost the campaign’s visibility (Cadbury, 2018).
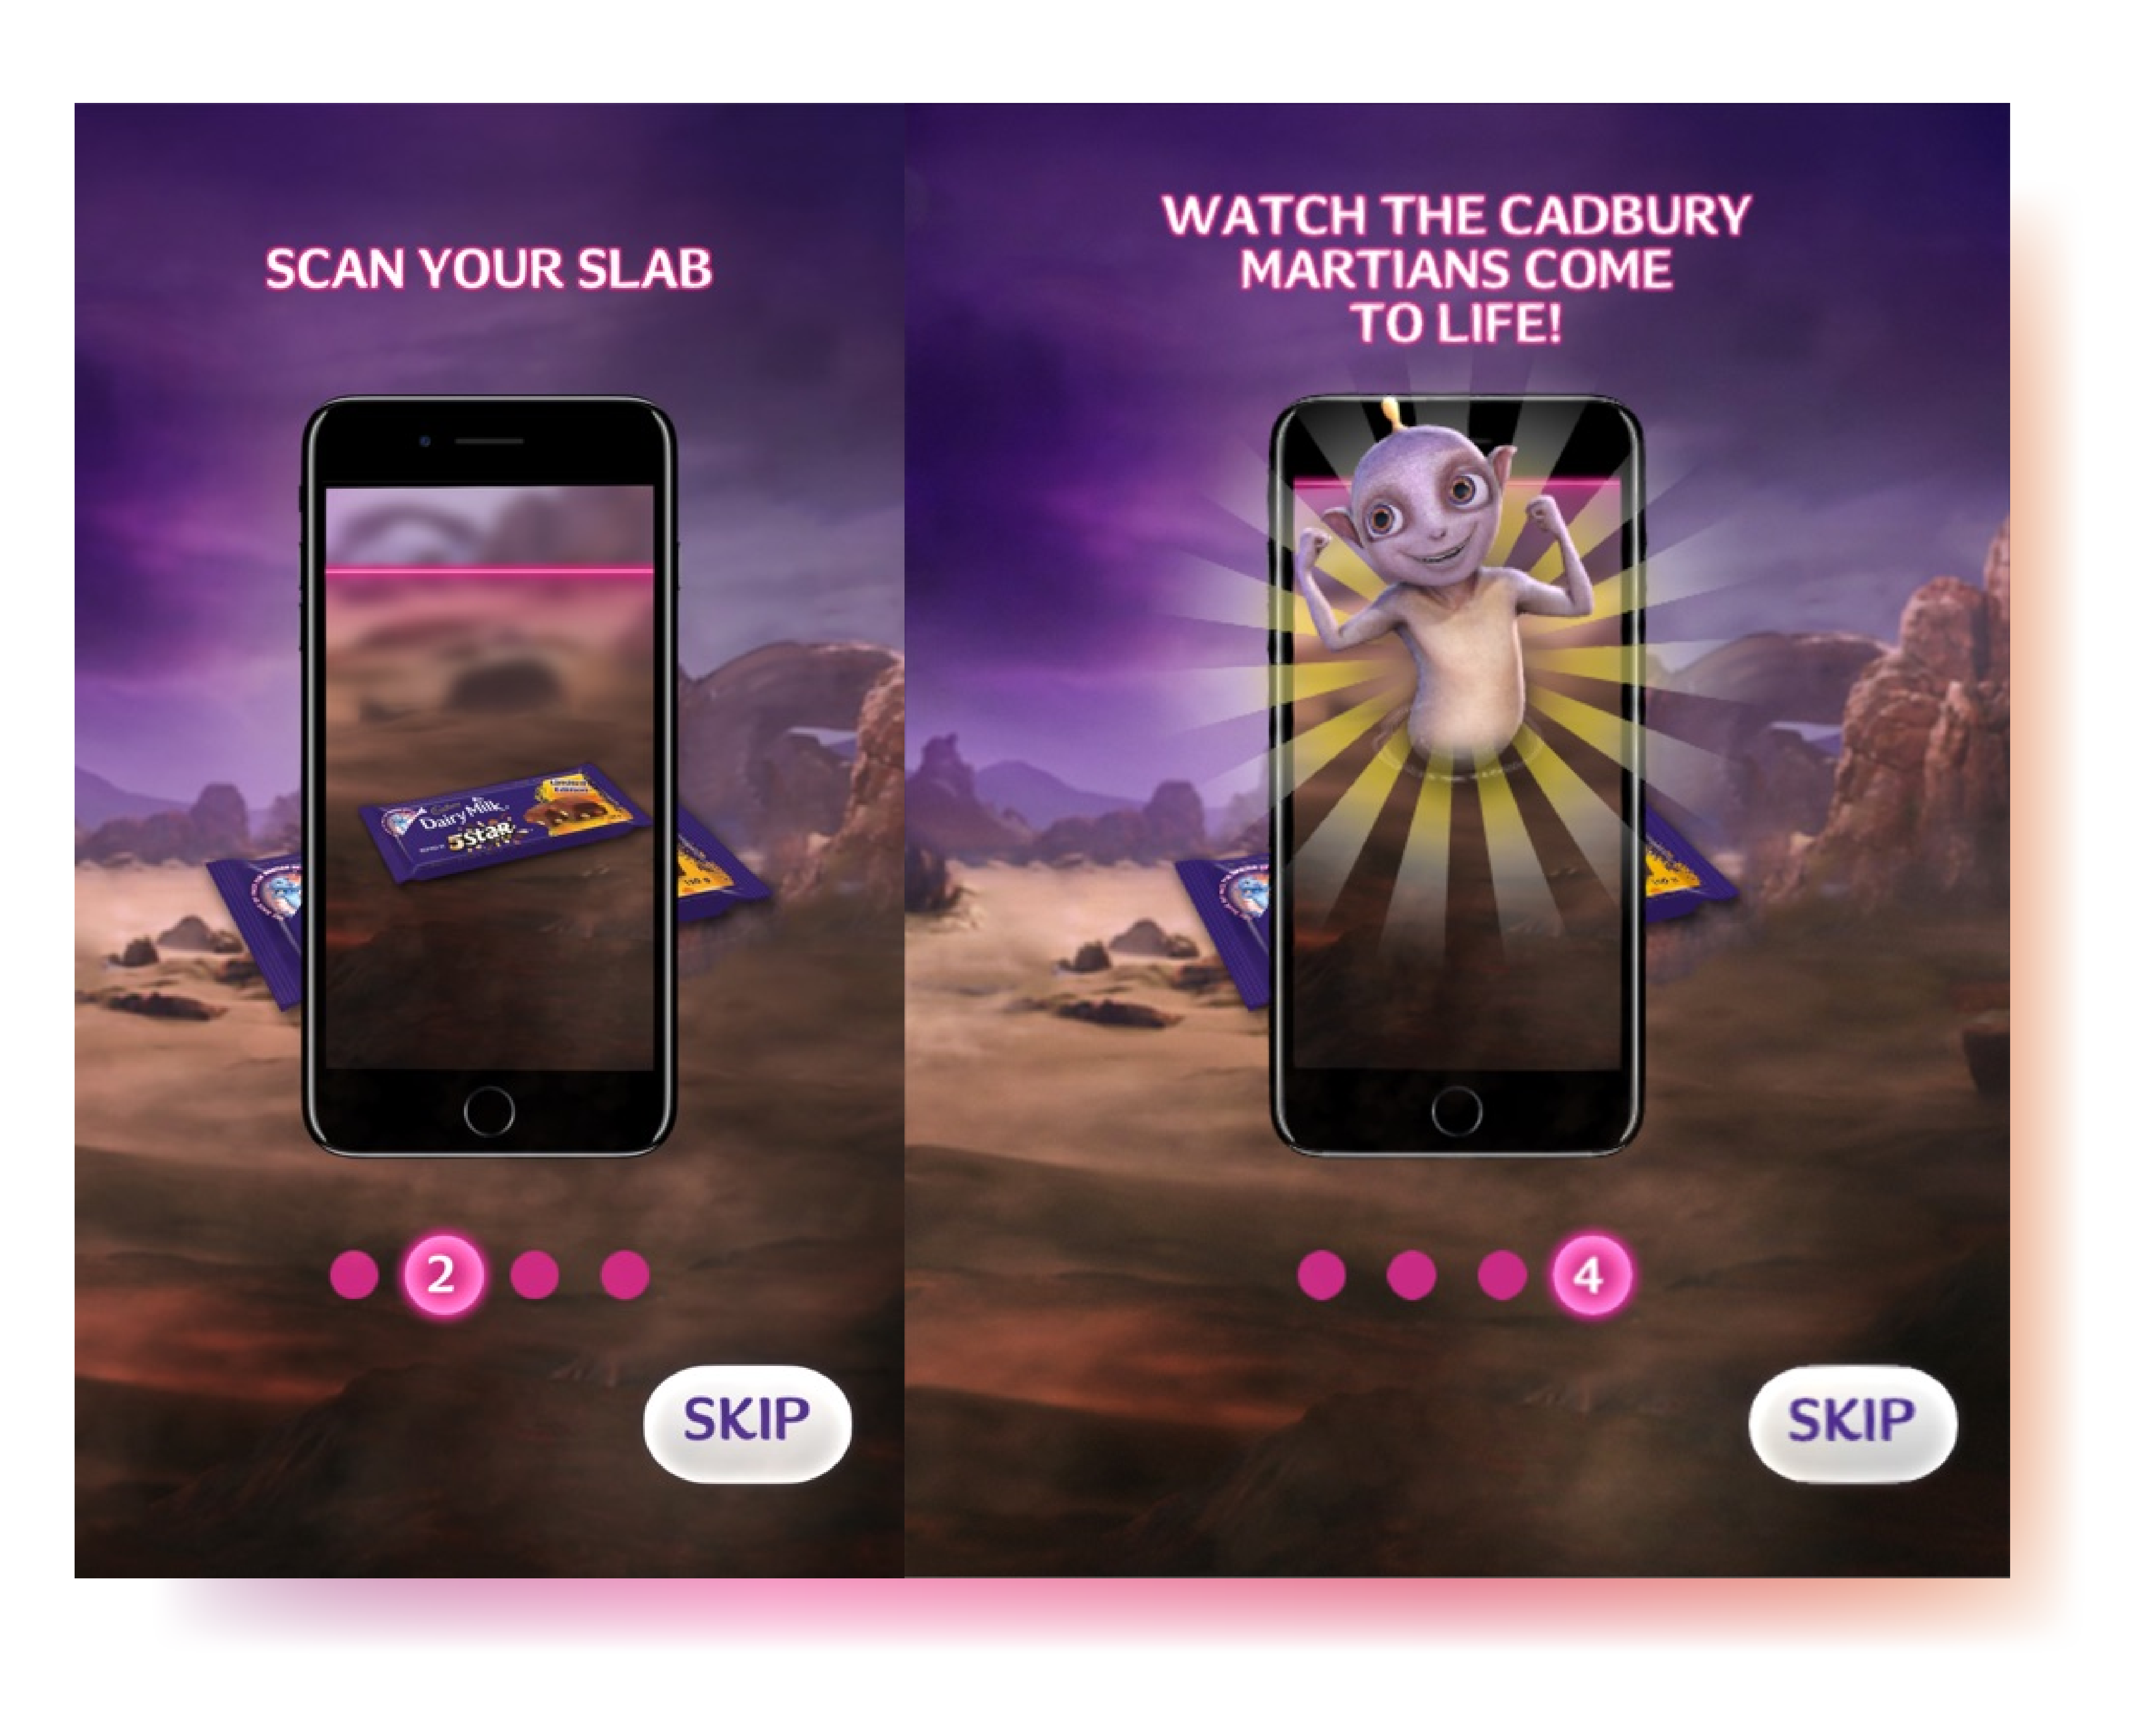
Figure 5. Cadbury’s Promotional Photos for #JoyOfANewKind
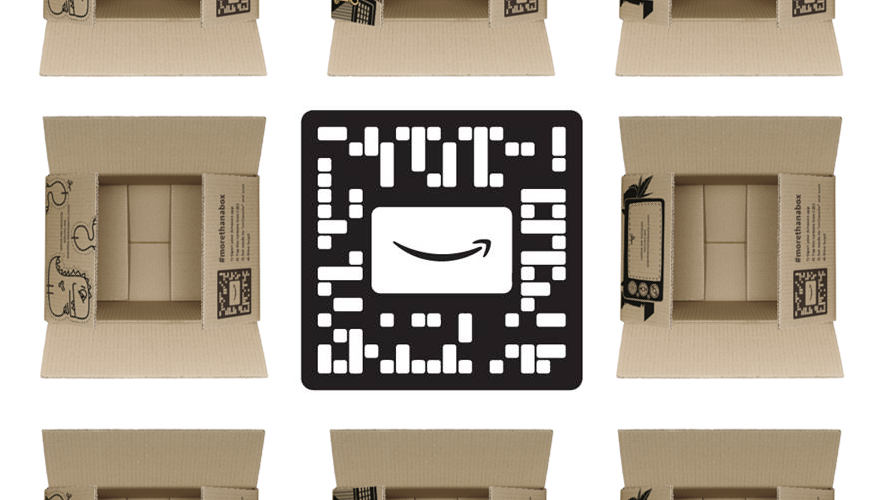
Amazon’s #SmileCodes campaign, launched in 2018, was centered around Amazon’s newSmileCode feature that was printed on shipping boxes and public advertisements. A SmileCode is a QR code designed with the Amazon smile logo in the center of the scannable area (Scanova Blog, n.d.). By scanning the code, the user is redirected to deals and discounts on Amazon products, details of a specific product, or information required to unlock Amazon Lockers, which is another relatively new service by Amazon. Unlike regular QR codes, SmileCodes require the official Amazon smartphone application to scan it (Ong, 2018). Printed advertisements were scattered around cities to promote the new features available using this type of QR code.

Figure 6. Amazon’s Smile Code
The Coca-Cola Company’s #WannaSprite campaign stemmed from a Sprite commercial released in 2016 wherein spokesperson Lebron James ended the commercial with the phrase “Wanna Sprite?” (Tribu Creative, n.d.). Alongside this commercial, Sprite released limited edition pop cans that had printed codes disguised as popular lyrics written by hip-hop artists. Upon scanning the code, consumers were able to win prizes ranging from company merchandise to popular electronic devices. Sprite also collaborated with Spotify to unlock playlists by scanning the pop can (Williams, 2017).
![]()
Figure 7. Sprite’s Limited Edition Pop Cans
2. ONLINE SURVEY
The survey was made available to the public using Google Forms, and most questions were based on the Technology Acceptance Model (TAM). To encourage people to complete the entire survey, it was important to keep it short in length and the response time to within a few minutes at most.
As such, the twelve TAM-based questions were presented on a five-point scale, rather than the traditional seven-point scale. Respondents were able to choose whether they “Strongly Agree”, “Agree”, “Neutral”, “Disagree”, or “Strongly Disagree” with each statement. “Strongly Agree” was represented as a “5” on the scale, and “Strongly Disagree” was a “1.” The mean was analyzed to understand the general perception of this technology by the participants.
In addition to the twelve items drawn from the TAM, these questions were also included in the survey:
- Age? (age ranges given)
- What forms of scannable print have you interacted with? (options given)
- Where have you seen scannable print? (options available)
- How often do you interact with scannable print? (time ranges given)
- How can the scannable print experience be improved / what does it do well? Additional thoughts? (quantitative)
- Do you want to see scannable print more widely available? (yes or no)
Together, these make a total of 18 questions (17 quantitative and 1 qualitative).
Due to time restraints, this survey was available to the public for a total of two weeks, which limited the amount of responses. Additionally, this survey was limited by the methods in which it would have reached the public. It was shared periodically through social media announcements directed toward acquaintances, coworkers, and friends. It was expected that the days wherein no social media announcement was released, the survey would have received less responses.
RESULTS
1. SOCIAL MEDIA REVIEW
As previously discussed, the social media review looked at the top twenty-five tweet results that displayed upon searching the keyword that corresponded to the campaign’s dedicated hashtag. While these campaigns were released to the public at similar points in time, the responses on Twitter were wildly different.
The #JoyOfANewKind campaign consisted of both scannable packaging with a code on the product’s wrapper as well as public interactive displays at shopping centres, which made use of augmented reality. While 68% of the search results (17 of 25 tweets) either spread the campaign message or had something positive to say, there was little mention of the scannable component of the campaign. Further, any mention of scannable technologies centered around the AR element. This potentially indicated that consumers were not interested in the process leading up to winning prizes or collecting figurines. Rather, consumers seemed motivated by the novelty of the activity they participated in, as well as the experience’s shareability online. If the provided activity or interaction was not exciting or explicitly beneficial, or if an instant reward was not given, consumers were unlikely to share the experience. In addition, consumers often shared about the product itself; in this case, it was about the newly released chocolate bar flavours instead of the campaign.
Further, a total of 32% of the search results (8 of 25 tweets) were advertisements for the campaign. This statistic showed that there was a reasonable amount of online activity for this campaign by consumers (68%), while companies and their partners also took the time to appeal to consumers online through many publicly available tweets.
This campaign heavily featured scannable technology, but there was little mentioned about the technology. Overall, tweets showed interest in the product, which undoubtedly led to sales and increased interaction for many with the classic brand, Cadbury.
The #SmileCodes campaign was used to promote the new feature Amazon was trying to implement, using their own version of a quick-response code (QR code). It generated many posts from online publications and some consumer interactions on Twitter. In fact, 72% of the search results (18 of 25 tweets) linked to articles published on other websites. This statistic shows that this new way of implementing a seemingly plateaued piece of technology sparked interesting conversations. These articles explained that Amazon’s SmileCodes added value to an otherwise plain piece of packaging, successfully extending its product lifecycle. Since its initial surge, however, there has been little mention of Amazon’s SmileCodes, if any.
Further, only 8% of the search results (2 of 25 tweets) were posted by individuals who boasted about the campaign in a positive light. This statistic showed that while a select few maybe interested in a new implementation of a technology, this interest may not be shared by the rest of society. Otherwise, the public did not have much interest in the idea of Amazon’s SmileCodes.
The #WannaSprite campaign spans several years, but was most recently active in 2018. Since its release, 60% of the search results (15 of 25 tweets) were mostly positive. However, none of the top twenty-five tweets mentioned the scannable aspect of the widespread campaign. In fact, consumers were far more interested in the product itself and the products won through the campaign. By analyzing the campaign’s extended history of having a relatively strong presence in consumer minds, it seemed reasonable that consumers were not receptive to the new implementation of scannable packaging.
In addition, the scannable portion of the packaging was not obvious to the regular consumer as it may easily be mistaken for an ordinary graphic on the aluminum can. While this method of implementing scannable print may be aesthetically ideal for the designer and the consumers’ viewing experiences, the affordances of scannable print technologies can easily be missed.
2. ONLINE SURVEY
Within two weeks, 120 online public survey responses were collected. Of these participants, 85.8% were between the ages of 19-29, 8.3% were aged 30-39, 4.2% were aged 40-49, and 1.7% were between the ages of 13-18. Knowing the ages of participants enabled conclusions to be drawn between generational norms and consumer behaviour.
All participants indicated that they have interacted with a form of scannable print technology, including QR Codes, AR, and NFC Tags, on many different mediums, such as advertisements, packaging, books, smartphone applications, in-store displays, and more. While the participants were aware of scannable print, 44.2% confessed that they rarely made use of scannable print technologies. Several elaborated that they rarely used the technologies, with the exception of NFC tags as a payment option in stores or on their commute.
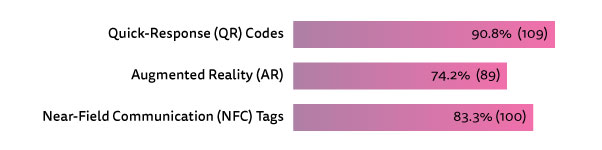
Figure 8. Results for Online Survey, Question 2
Next, statements from the Technology Acceptance Model were explored. Twelve statements about scannable print’s usefulness and ease of use were presented to the participants to rate based on their experience. This method was used rather than TAM’s traditional use of evaluating the workplace. Below is a chart that indicates the average responses for each statement based on the five-point scale provided to the participants.
Table 1: Mean Results from Online Survey, Question 5 to 16
|
Usefulness Statements |
Mean Result |
|
Using scannable print enables me to accomplish my tasks more quickly. |
3.83 |
|
Using scannable print improves my performance. |
3.35 |
|
Using scannable print increases my productivity. |
3.38 |
|
Using scannable print enhances my effectiveness. |
3.47 |
|
Using scannable print makes my life easier. |
3.90 |
|
I find scannable print useful. |
3.95 |
|
|
3.65 |
|
Ease of Use Statements |
Mean Result |
|
Learning to operate scannable print is easy for me. |
4.23 |
|
I find it easy to get scannable print to do what I want it to do. |
3.63 |
|
My interaction with scannable print is clear and understandable. |
3.98 |
|
I find scannable print to be flexible to interact with. |
3.63 |
|
It is easy for me to become skillful at using scannable print. |
3.91 |
|
I find scannable print easy to use. |
4.08 |
|
|
3.91 |
Results showed that the public viewed the operation of scannable technologies as straightforward and easy. However, its usefulness did not measure as highly, suggesting that the public was indifferent to its utility as a key component in their daily lives.
Lastly, consumers were asked to make final comments and to indicate if they wanted to see scannable print become more widely available. A total of 66% of participants replied “Yes” (they would like to see it more widely available), while 28.2% replied “I don’t know” or that they were indifferent to it, and 5.8% replied “No”.
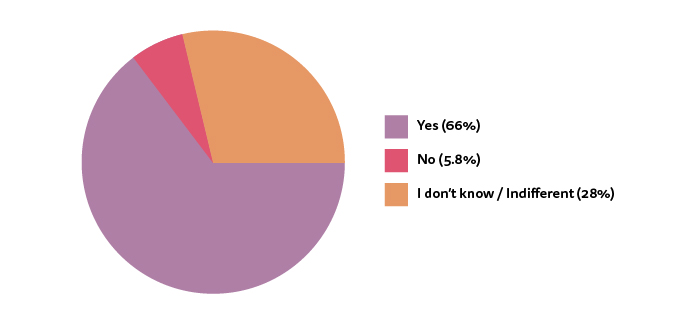
Figure 9. Results for Online Survey, Question 18
The final comments included a mix of opinions, but no responses directly criticized the idea of scannable print. Instead, consumers were either frustrated with its implementation and accessibility, or they did not express any strong opinions on the topic.
DISCUSSION
Using the mixed method research technique revealed two important takeaways that allowed for a better understanding of scannable print on packaging for both marketers and consumers alike.
1. SCANNABLE PRINT TECHNOLOGIES SHOULD BE APPLIED MORE THOUGHTFULLY FOR IMPROVED USEFULNESS
Thoughtfulness, in this case, refers to the product the technology promoted or was directly printed on, as well as its overall usefulness for the consumer.
As seen in the social media review, consumers were not interested in the scannable print technology as much as the product it was implemented on, or the rewards they would gain from taking the extra step to interact with the product.
For example, Coca-Cola’s #WannaSprite campaign featured several different elements, including the commercials, Spotify playlists, and the scannable print on the cans. Although marketing efforts were clearly taken, the product itself was highlighted above any of these. Further, the scannable print technology available in this campaign was not mentioned in the top twenty-five results when “#WannaSprite” was searched on Twitter.
In contrast, there was far more mention of scannable print technology for the #JoyOfANewKind campaign. Cadbury made use of two different scannable technologies: quick-response codes on product packaging and augmented reality stations at shopping malls. Of the top twenty-five tweets, 40% (10 of 25 tweets) mentioned AR experiences while 0% mentioned experiences with the scannable QR code technology on the product packaging.
In light of this, it is compelling to consider the products which were used as the foundation for these campaigns. Coca-Cola’s Sprite product reached retail shelves in 1961 and is now sold in nearly two hundred countries (Coca-Cola, n.d.). As one of the most popular carbonated drinks worldwide, it has almost become a symbol in pop culture. On the other hand,Cadbury has been in business since the 1800s, but their martian mascots have only been around since 2017 (Cadbury, 2018). As the #JoyOfANewKind campaign launched an entire year after the introduction of these characters, consumers continued to be receptive to changes and additions made to the product. For this reason, consumers seemed to be more willing to engage with the activities and prizes available by scanning the packages and participating in the AR events. The product acted as an entertaining activity for children and adults alike, rather than just being a treat.
Looking beyond the product this technology was implemented on, the data gathered through the social media review showed that of the seventy-five tweets among the three different campaigns, only two tweets had something negative to say, and neither spoke poorly about the scannable print technology itself.
Over the years, scannable print technology has been refined to work well when placed in the correct type of environment. However, the results of the public online survey made it evident that the technology’s usefulness lacked presence in consumer minds. For example, the results for ease of use were more agreeable than those for usefulness in the twelve statements provided to the participants (six for usefulness and six for ease of use). There are two possible reasons for the survey results that are a direct result of the qualitative question asked at the end of the survey: “How can the scannable print experience be improved / what does it do well?Additional thoughts?” Each participant had unique responses, but many reiterated the idea that its application should be considered more thoughtfully.
Currently, most scannable print applications, especially QR codes, are used with the simple intention of redirecting the user to a company website or an application on the App/Play store on their smartphone device. However, many users viewed the technology as pointless because they are accustomed to typing their intended digital destination into a web browser. One participant stated, “I think it can enhance user experience, but I’m more of the type to take note of an advertisement and… check it out on the website later as opposed to scan it right there.” Given that this respondent was between 19 and 29 years old, it is unlikely that they had trouble operating the technology; more likely, the benefits of scanning the print were simply not useful enough to induce interaction. To combat this, several participants shared ideas they believed would have made this technology worth the time it required the users to expend. For example, it may be used on perishable items to indicate shelf life, or in a classroom setting to interact with students beyond printed powerpoint slides.
By these reactions, it is clear that consumers require sufficient reasons to engage with this technology.
Innovative ideas are essential for success, and while change may be daunting for many businesses, scannable technology may offer the improvements they seek to benefit their brand as a whole. Interactivity with consumers may easily be the difference between them picking up the product off the shelf or making the decision to purchase the product.
2. SCANNABLE TECHNOLOGIES SHOULD BE UNIFIED FOR IMPROVED EASE OF USE
Research revealed that users were also deterred from scannable print technology because the technology was required to be used sporadically, and applications are often proprietary. One participant stated “[It] is oftentimes attached to a specific app or program, making it difficult to use and be accessible for all. It would be great to see more incorporation of scannable print into day to day technology.” Another participant expressed that scannable print should “…be recognized by all cameras.” As the world becomes increasingly dependent on technology, these suggestions do not seem unrealistic. If technology becomes completely integrated into the daily lives of consumers, it should become as accessible as possible. Otherwise, the added effort required to interact with something that has previously shown to provide minimal advantages would likely not be worthwhile to consumers.
An example of scannable print that proved to be worth consumers’ time was Tesco’s virtual stores, which were set up in South Korea in 2011 and consisted of “a display of products on walls of metro stations and bus stops” (Petit de Meurville et al., 2015). Scanning displays with their smartphones, consumers were able to shop as if they would at a grocery store, pay online, and even schedule the product delivery, which, “created a new market based on a country’s lifestyle” (Petit de Meurville et al., 2015). These virtual stores effectively resulted in over 900,000 app downloads within a year, which increased Tesco’s online sales immensely, and prompted many more users to register on their app (Petit de Meurville et al., 2015). While the experience required slightly more effort from individuals because they had to download the unique smartphone application, the benefits enjoyed by the consumers outweighed the effort. As a result, Tesco was able to strategically use this relatively simple piece of technology (QR codes) by understanding the needs of their target demographic in order to entirely improve their brand image and loyalty in South Korea.
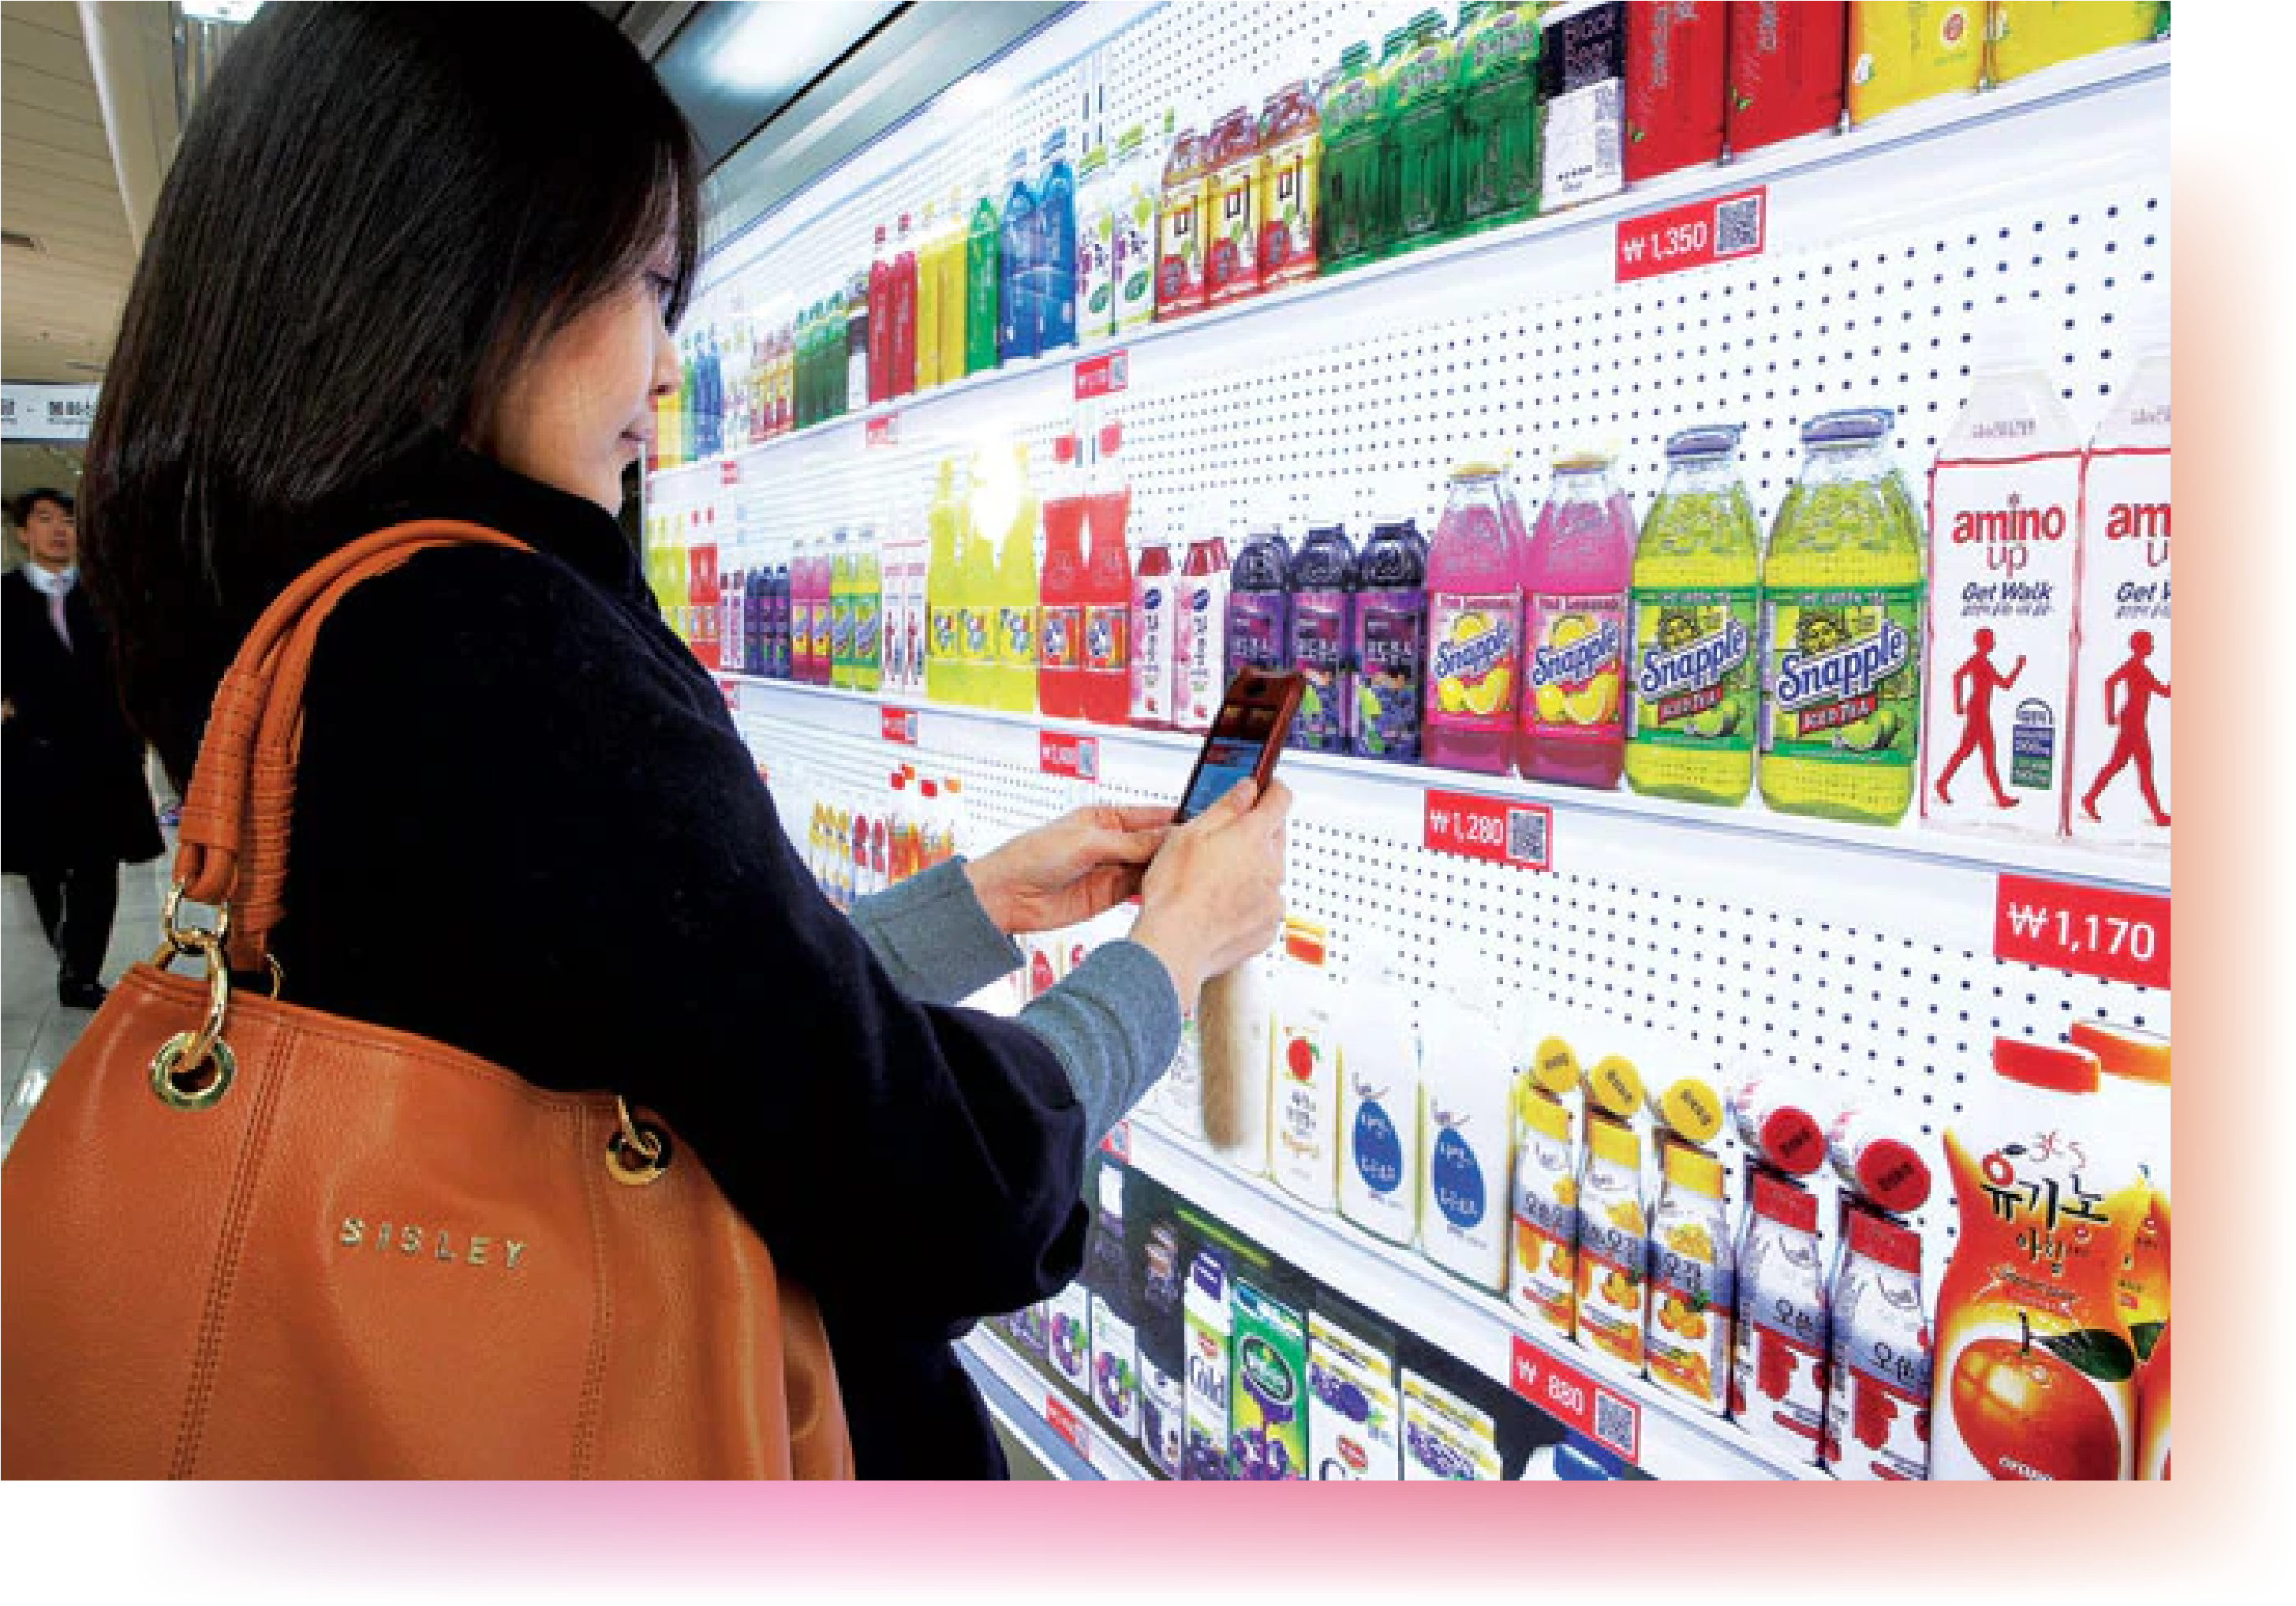
Figure 10. Tesco’s Hybrid Store
Participants also suggested that scannable technology should “allow data-less users to store the URL for later access,” and that “[it] reduces the effectiveness of print by requiring an additional device and internet connection.” As previously mentioned, many companies took the easy route and simply had their scannable print redirect consumers to their company website oran application download. However, this quickly became inaccessible without an internet connection. Perhaps creating uses for the technologies that do not require an internet connection, or providing a feature that allows the consumer to save the link for a later time would prove useful to many users. The creation of a unified experience for the consumer, regardless of the company they tried to contact, may be key to better integration of scannable print in Western culture.
CONCLUSION
Through analysis of the available literature on scannable print technologies as well as the mixed method research results, it is clear that scannable print has not yet reached its potential in Western cultures. There are many ways to improve its usefulness and generate a better sense of the technology in consumer minds. Companies are encouraged to develop creative approaches to integrate scannable print technologies in their product packaging to create an engaging and interactive experience with the consumer. This may improve brand image and brand loyalty towards the product, or even the brand itself.
Scannable print, especially the use of QR codes, has slightly plateaued since its surge in recent years. However, it requires further research and development in the marketplace. Companies such as Digimarc and Blippar continue to work to create new experiences for consumers, such as the popularity of augmented reality within social media applications, and camouflaged scannable codes on print packages. As the world becomes increasingly more digital, companies should embrace this reality by incorporating scannable print technologies into their products and service offerings.
REFERENCES
Alhamdi, F. M. (2019). Role of packaging in consumer buying behaviour. Management Science Letters, 10(6), 1191-1196.
Amazon. [digital image]. Retrieved from https://www.adweek.com/wp-content/uploads/2018/05/amazon-smile-code-content-2018.png
Asare, I.T., & Asare D. (2015). The effective use of quick response (QR) code as a marketing tool. International Journal of Education and Social Science. 2(12). 67-73.
Cadbury. (2018, October 22). The Cadbury Martians are back to Discover Joy Of A New Kind. http://cadburyjoyvault.co.za/32770-the-cadbury-martians-are-back-to-discover-joy-of-a-new-kind
Campbell, M., Kelly, S., Lang, J., & Immerman, D. (2019). The state of industrial augmented reality 2019 [White paper]. PTC. https://www.ptc.com/-/media/Files/PDFs/Augmented-Reality/State-of-AR-Report-2019.pdf
Coca-Cola. (n.d.). Sprite. https://www.coca-cola.co.uk/brands/sprite
Coskun, V., Ozdenizci, B., & Ok, K. (2015). The Survey on Near Field Communication. Sensors, 15(6), 13348-13405. doi:10.3390/s150613348
Creswell, J.W. (2003). Research design: Qualitative, quantitative, and mixed methods approaches (2nd ed.). Sage Publications. 208-210.
Erasmus, E., Rothmann, S., & van Eeden, C. (2015). A structural model of technology acceptance. SA Journal of Industrial Psychology, 41(1), 01-12. doi:10.4102/sajip.v41i1.1222
Fortin, D.R., & Surovaya, K. (2018). Measuring the effects of visual scan codes in advertising. Int. J. Internet Marketing and Advertising, 12(4), 358-373. doi:10.1504/IJIMA.2018.095379
Glacier Media, [photograph]. Retrieved from https://images.glaciermedia.ca/polopoly_fs/1.21210630.1500373156!/fileImage/httpImage/image.jpg_gen/derivatives/landscape_804/photo-apple-pay.jpg
Holst, A. (2019). Number of smartphone users worldwide from 2016 to 2021. Statista. https://www.statista.com/statistics/330695/number-of-smartphone-users-worldwide
ntelliFLEX, intelliPACK,& PAC Packaging Consortium. (n.d.). Driving new levels of consumer engagement through intelligent packaging [White paper]. intelliFLEX Innovation Alliance. https://www.pac.ca/wp-content/uploads/2020/06/iia-whitepaper-intelligent-packaging.pdf
Kallas, P. (2020). Top 15 Most Popular Social Networking Sites and Apps [2020]. DreamGrow. https://www.dreamgrow.com/top-15-most-popular-social-networking-sites/
Krevelen, D.W.F., Poelman, R. (2010). A Survey of Augmented Reality Technologies, Applications and Limitations. The International Journal of Virtual Reality, 9(2), 1-20.
Lee, Y., Kozar, K.A., & Larsen, K.R.T. (2003). The Technology Acceptance Model: Past, Present, and Future. Communications of the Association for Information Systems, 12(50). 752-780. doi:10.17705/1cais.01250
Lexico. (2020). Packaging. https://www.lexico.com/definition/packaging
Lildoremi.org. [photograph]. Retrieved from https://akm-img-a-in.tosshub.com/sites/btmt/images/stories/tesco-660_012715012420.jpg
Okazaki, S., Li, H., & Hirose, M. (2012). Benchmarking the use of QR code in mobile promotion: Three studies in Japan. Journal of Advertising Research, 52(1), 102-117. doi:10.2501/JAR-52-1-102-117
Ong, T. (2018). Amazon’s SmileCodes are QR codes users scan to get discounts and other offers. The Verge. https://www.theverge.com/2018/1/31/16954336/amazons-smilecodes-qr-codes-discounts
Peddie, J. (2017). Augmented reality: Where we will all live. Cham: Springer.
Petit de Meurville, M., Pham, K., & Trine, C. (2015). Shop on the go. Business Today. https://www.businesstoday.in/magazine/lbs-case-study/case-study-tesco-virtually-created-new-market-based-on-country-lifestyle/story/214998.html
Scanova Blog. (n.d.). Amazon SmileCodes: The New 2D Barcodes That Help You Avail Amazon Benefits. https://scanova.io/blog/amazon-smilecodes/
Silayoi, P., & Speece, M. (2007). The importance of packaging attributes: A conjoint analysis approach. European Journal of Marketing, 41 (11/12), 1495-1517. doi:10.1108/03090560710821279
Sauro, J. (2019). 10 Things to Know About the Technology Acceptance Model. MeasuringU. https://measuringu.com/tam/
Soon, T.J. (2008). QR code. Synthesis Journal, 59-78.
Tribu Creative. (n.d.). Wanna Sprite?. https://wearetribu.com/wanna-sprite/
Unknown. [digital image]. Retrieved from https://is5-ssl.mzstatic.com/image/thumb/Purple115/v4/32/31/e9/3231e9ec-1eb4-c470-bdd2-1e3466123928/pr_source.png/750x750bb.jpeg
Unknown. [digital image]. Retrieved from https://is3-ssl.mzstatic.com/image/thumb/Purple125/v4/75/65/aa/7565aac4-c976-1faf-8dd1-36e75ba1032a/pr_source.png/643x0w.jpg
Unknown. [digital image]. Retrieved from https://www.brandchannel.com/wp-content/uploads/2017/09/sprite-summer-app-scan-lil-yachty.jpg
Van Krevelen, D.W.F., & Poelman, R. (2010). A Survey of Augmented Reality Technologies, Applications and Limitations. The International Journal of Virtual Reality, 9(2), 1-20. doi:10.20870/IJVR.2010.9.2.2767
Watson, C., McCarthy, J., & Rowley, J. (2013). Consumer attitudes towards mobile marketing in the smart phone era. International Journal of Information Management, 33(5), 840-849. doi: 10.1016/i.ijinfomgt.2013.06.004
Williams, R. (2017). Coca-Cola’s summer Sprite campaign includes scannable hip-hop lyrics. Mobile Marketer. https://www.mobilemarketer.com/news/coca-colas-summer-sprite-campaign-includes-scannable-hip-hop-lyrics/445357/
Wikimedia. [digital image]. Retrieved from https://upload.wikimedia.org/wikipedia/commons/6/67/Technology_Acceptance_Model.png
APPENDIX
SOCIAL MEDIA REVIEW (RESULTS)
SURVEY (QUESTIONS AND RESULTS)