
Inpatient GI
Assess
Page Contents

Gathering Data for an Assessment
Gather the following information for your assessment:
- Clinical Data: History of presenting illness (HPI), investigations, pathology, scheduled procedures, consultations, medical orders (medications, infusions), clinical documentation (fluids in and out, bowel movements, drains and tubes, vitals, and documentation of symptoms), medical plan, disposition plan.
- Anthropometric Data: Weight, height, BMI, % weight change, % usual body weight, physical assessment, subjective global assessment.
- Nutritional Requirements: energy, protein, and fluid.
- Biochemical Data: Laboratory values.
- Dietary Data: Estimation of caloric/protein/ fluid requirements, hospital diet order, dietary restrictions, allergies, eating behaviour and patterns, 24 hour recall, calorie counts, supplements, previous nutrition interventions.
Before asking the patient questions for your assessment, make sure to introduce yourself and set the agenda for the discussion.
Subjective Global Assessment
According to the Canadian Malnutrition Task Force:
Subjective global assessment (SGA) is the gold standard for diagnosing malnutrition. SGA is a simple bedside method used to diagnose malnutrition and identify those who would benefit from nutrition care. The assessment includes taking a history of recent intake, weight change, gastrointestinal symptoms and a clinical evaluation.
You can refer to the SGA Form (PDF, 2017) from Dr. Jeejeebhoy and the Canadian Malnutrition Task Force for further practice.
Watch the video below (6:36) from UC San Diego Health. It demonstrates a nutrition-focused physical exam for identifying malnutrition. Note: captions were not uploaded for this external video, but you can read a read a transcript for the video (PDF) instead.
Case Study: Meet Sam

Your patient, Sam Stevenson
You are a Registered Dietitian (RD) in the Gastroenterology unit of a hospital. The patient you are assessing is a 42 year old male named Sam Stevenson. You have been following this patient but your assessment (for the purposes of the case study) is on day 2 post-operation/ hospital admission.
Clinical Data
Clinical data can include, but is not limited to:
- Reason for visit: hospital visit or RD assessment.
- Past medical history (PMHx): health history to date.
- History and presenting illness (HPI): symptoms, surgeries, prognosis, tests (i.e. CT scan, ultrasound)
- Current medical orders: IV infusions, medications (IV or oral), relevant consultations (i.e. RD, Speech Language Pathologist (SLP), Physiotherapist (PT), Gastroenterologist, etc.).
- Clinical documentation: Fluids intake (i.e. oral, IV, TPN/EN) and output (i.e. urine, vomit, bowel movements, drains (i.e. catheter, chest tube, surgical site drain) and suctioning (i.e. oral secretions, OGT to straight drain), documentation of tubes (i.e. G-tube vs. NGT) and lines (i.e. PICC), and vitals.
- Medical care plan and disposition: chemotherapy, radiation therapy, scheduled surgery, transfer to different floor, rehab facility, treatment facility, long term care, home.
Sam’s Clinical Data & Documentation
Review Sam’s clinical data. Take note of components that you think may be of importance for a nutrition care plan or to consider in the context of his patient care.
- Age: 42-year-old male
- HPI: 5-year history of Crohn’s disease, frequent hospital admissions for pain and diarrhea, worsening frequency of flares.
- Admission: 3 days ago for intense pain, diarrhea, nausea and decreased appetite – unable to work for the past 2 weeks – poor dietary intake – has lost over 15 kg over the past two months and 3 kg over the last two weeks.
- Pathology: Crohn’s disease.
- Operations/ Procedures: Investigation reveals ischemic tissue in the ileum – GI surgeon performs an ileocaecal resection removing 70 cm of the terminal ileum. Temporary ileostomy to allow the colon to rest (re: extensive inflammation).
- Consultations: RD consult for diet order progression and ileostomy education.
- Medications:
- Prednisone (a corticosteroid): On a daily dose of 10 mg/day for the past 2 months. MD increased dose to 30 mg/day IV while in hospital.
- Metronidazole (an antibiotic): MD prescribed 500 mg IV while in hospital (post-op)
- Pantoprazole (a proton pump inhibitor): MD prescribed 40 mg IV while in hospital (post-op)
- Look up each of these medications and determine why Sam is receiving them and the potential side effects
- Medical plan: Medical Doctor (MD) plans for Sam to stay in hospital for ~3-5 days post-op for monitoring (pending possible complications). Temporary ileostomy – plan to complete resection in 3 months.
- Disposition plan: home once stable.
Review Sam’s clinical documentation. Note that your assessment is on day 2 post-op.
- Day 0 (day of his surgery) post-op: patient was (with ice chips)
- Day 1 post-op: patient was ordered clear fluids.
- Symptoms: On day 0, nurse reports that patient was complaining of nausea and fatigue – consumed a cup of ice chips. On day 1, nurse reports that patient is feeling better, is drinking clear fluids (water, juice ~ 800 mL/day) consistently and is walking around the ward (infrequently). Patient still fatigued and weak.
- Infusions: MD ordered (on day 0 of post-op) IV ⅔ and ⅓ @100 mL/hour = 2400 mL/day
- Ostomy output: Day 0 = 200 cc; day 1 = 1200 cc; referred to as an ‘active ileostomy’
- Urine output: Day 0 = 720 mL (~30 mL/hour); Day 1 = 1,500 mL (~60 mL/hour)
As your assessment is taking place on day 2 post-op, you would have access to 2 days worth of important clinical documentation and information to inform your next steps for the nutrition care plan.
A key component is the assessment of fluid intake and ostomy output at this stage. We need to make sure the ostomy is functioning, referred to as an active ileostomy, before progressing Sam’s diet. Fluid intake is an important component of his care plan in regard to preventing dehydration and electrolyte imbalance given his recent surgery. Urine output is important in reviewing Sam’s fluid balance.
Anthropometric Data
Assessment of Body Weight
Body weight is the most used indicator of nutritional status, as it is used for calculating fluid, protein, and energy requirements.
Important considerations to identify include:
- adjustments in weight (i.e. amputations, fluid retention)
- if this is the most appropriate weight to use for calculations (i.e. are you overfeeding or underfeeding?)
- the weight you are feeding
Obtaining height and age is often necessary to further interpret body weight. Body Mass Index (BMI) is commonly used as a classification to evaluate health risk, as demonstrated in the table below. Master’s tables are used for adults aged 65+.
| Classification | BMI Category (kg/m2) | Risk of Developing Health Problems |
|---|---|---|
| Underweight | <18.5 | Increased |
| Normal weight | 18.5-24.9 | Least |
| Overweight | 25.0-29.9 | Increased |
| Obese class I | 30.0-34.9 | High |
| Obese class II | 35.0-39.9 | Very high |
| Obese class III | >40.0 | Extremely high |
| Time Frame | Significant Weight Loss (%) | Severe Weight Loss (%) |
|---|---|---|
| 1 week | 1-2 | > 2 |
| 1 month | 5 | > 5 |
| 3 months | 7.5 | > 7.5 |
| 6 months | 10 | > 10 |
| Unlimited time | 10-20 | > 20 |
| UBW range (%) | Interpretation |
|---|---|
| 85 – 95 | May indicate mild malnutrition |
| 75 – 84 | May indicate moderate malnutrition |
| < 74 | May indicate severe malnutrition |
Sam’s Anthropometric Data: Body Weight
- Height: 6’1″ (1.86 m)
- Imperial to metric conversion: 6’1″ tall = 73.2 inches (12 inches/ft) × 2.54 cm/inch = 186 cm
- Current weight: 145 lbs (65.9 kg)
- Imperial to metric conversion: 145 lbs ÷ 2.2 lbs/kg = 65.9 kg
- Current BMI: 19.1 kg/m²
- Calculation: 65.9 kg ÷ 1.86 m² = 19.1 kg/m²
- Usual weight: 180 lbs (reported by patient)
- Timeframe of weight loss: 2 months
- % weight loss: 19.4%
- Calculation: [81.8 kg − 65.9 kg] ÷ 81.8 kg) × 100 = 19.4%
- % UBW: 80.6%
- Calculation: (65.9 kg ÷ 81.8 kg) × 100 = 80.6%
Physical Assessment
Another important assessment strategy is to physically evaluate your patient. It is important to go into your patient’s room to evaluate physical signs and symptoms of malnutrition. The SGA provides guidance on how to complete a physical examination by using a head-to-toe method for the assessment of muscle wasting, subcutaneous fat, and fluid retention.
| Physical Examination | Normal | Moderate | Severe |
|---|---|---|---|
| Temple | Well-defined muscle | Slight depression | Hollowing, depression |
| Clavicle | Not visible in males, may be visible but not prominent in females | Some protrusion; may not be all the way along | Protruding/prominent bone |
| Shoulder | Rounded | No square look, process may protrude slightly | Square look, bone prominent |
| Scapula/ribs | Bones not prominent | Mild depression or bone may show slightly | Bone prominent, significant depressions |
| Quadriceps | Well defined | Depression/ atrophy medially | Prominent knee, severe depression medially |
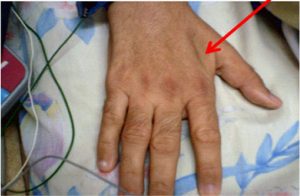
| Interosseous muscle between thumb and forefinger (back of hand)** | Muscle protrudes, could be flat in females | Slightly depressed | Flat or depressed area |
| Physical Examination | Normal | Moderate | Severe |
|---|---|---|---|
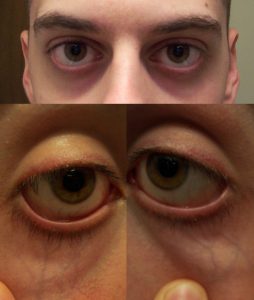
| Under the eyes | Slightly bulging area. | Somewhat hollow look, slightly dark circles. | Hollowed look, depression, dark circles. |
| Triceps | Large space between fingers. | Some depth to fat tissues, but not ample. Loose fitting skin. | Very little space between fingers or finger touch. |
| Ribs, lower back, sides of trunk | Chest is full, ribs do not show. Slight to no protrusion of the . | Ribs obvious, but indentations are not marked. Iliac crest somewhat prominent. | Indentation between ribs obvious. Iliac crest very prominent. |
| Physical Examination | Normal | Moderate | Severe |
|---|---|---|---|
| Edema | None | Pitting edema of extremities / pitting to the knees, possible edema if bedridden | Pitting beyond knees, sacral edema if bedridden, may also have generalized edema |
| Ascites | Absent | Present (may only be present on imaging) | Present (may only be present on imaging) |
Sam’s Anthropometric Data: Physical Assessment
- Physical exam reveals moderate muscle wasting and moderate loss of subcutaneous fat
- Slight depression of temples and protrusion of clavicle and shoulder
- Ribs showing
- No distension in abdomen
- No edema
- Patient can ambulate, but walks infrequently due to weakness
- Temperature and respiratory rate normal
Review Sam’s physical assessment data. Overall, the physical assessment using the SGA reveals moderate muscle wasting and moderate loss of subcutaneous fat.
Nutritional Requirements
Energy Requirements
Predictive equations are for estimation purposes only. The most accurate data will provide the most accurate estimation, but without indirect calorimetry this is the best we can achieve. As a result, there is a need for frequent re-assessment of energy requirements.
Factors affecting the accuracy of estimated requirements include:
- Acute or chronic respiratory distress syndrome
- Large open wounds or burns
- Malnutrition with altered body composition
- Underweight, obesity, limb amputation, peripheral edema, ascites
- Multiple or neurological trauma
- Multisystem organ failure
- Postoperative organ transplantation
- Sepsis
- Systemic inflammatory response syndrome
- Paralytic or barbituate agents
Predictive Equations
Here are three commonly used predictive equations. There are other predictive equations you may use, depending on your area of practice. Accuracy varies by equation and population. Experience is helpful for an accurate selection and utilization of these predictive equations.
Abbreviations:
- EER = estimated energy requirements
- REE = resting energy expenditure (kcal)
- A = age (years)
- PA = physical activity
- W = weight (kilograms)
- H = height (centimetres, unless otherwise specified)
- H* = height (metres)
- Dietary Reference Intakes (DRI)
- EER: age, physical activity, weight, height
- Males: EER (kcal) = 662 − 9.53A + PA × (15.91W + 549.6H*)
- Females: EER (kcal) = 354 − 6.91A + PA × (9.36W + 726H*)
- Harris Benedict (HB)
- REE: weight, height, age
- Males: REE (kcal) = 66.5 + 13.75W + 5.0H − 6.78A
- Females: REE (kcal) = 655.1 + 9.56W + 1.85H − 4.68A
- Mifflin-St.Jeor (MSJ)
- REE: weight, height, age
- Males: REE (kcal) = 9.99W + 6.25H − 4.92A + 5
- Females: REE (kcal) = 9.99W + 6.25H − 4.92A − 161
- Estimated Calories/kg
Activity Factors
Most predictive equations evaluate resting energy expenditure (REE), meaning you need to consider physical activity energy expenditure in addition to the original calculation. The activity factor (AF) is applied to the REE value. Activity factors are not to be used with DRI equations.
| Activity Level | AF |
|---|---|
| *Resting (lying or sitting) | 1.0 – 1.4 |
| Lying still, sedated or asleep | 0.9 – 1.1 |
| Lying still, conscious | 1.0 – 1.1 |
| Spinal cord injury, 0-4 weeks post-injury | 1.1 |
| Bedrest (moving self around bed) | 1.15 – 1.2 |
| Mobilizing occasional on ward | 1.15 – 1.4 |
| *Sedentary/ Light Activity (standing for long periods) | 1.4 – 1.6 |
| Mobilizing frequently on ward | 1.4 – 1.5 |
| Regular, intensive physiotherapy | 1.5 – 1.6 |
| *Moderate Activity (continuous movement/slow walking) | 1.6 – 1.8 |
Stress Factors
Most predictive equations evaluate resting energy expenditure (REE), meaning you may need to consider energy expenditure from stress. The stress factor is applied to the REE value.
| Clinical Status | SF |
|---|---|
| Cancer | 0.8 – 1.5 |
| Elective surgery | 1.0 – 1.1 |
| Peritonitis | 1.05 – 1.25 |
| Multiple/ long bone fractures | 1.1 – 1.3 |
| Fever | 1.2 per 1°C > 37°C |
| Spinal cord injury, 0-4 weeks post-injury | 1.2 |
| Sepsis | 1.2 – 1.4 |
| Severe infection | 1.2 – 1.6 |
| Burns | 1.2 – 2.0 |
| Infection with trauma | 1.3 – 1.55 |
| Multiple trauma, traumatic brain injury | 1.4 |
Protein Requirements
The table below represents general guidelines for protein requirements according to how hypermetabolic your patient is. Consider your individualized patient to determine the most accurate protein requirement. Experience using these methods is helpful. You can consider calculating requirements using various methods and compare values.
| Patient Category | Protein (g/kg) |
|---|---|
Not hypermetabolic:
|
0.8 – 1.5
(1.0 – 1.5 for |
Moderately hypermetabolic, including:
|
1.2 – 1.5 |
| Hypermetabolic, including multi-trauma |
1.5 – 2.0
|
The following table represents a more detailed overview of protein requirements specific to various clinical conditions. This may be more useful for you during practice than the general guidelines, if your patient’s clinical status is reflected in this table.
| Clinical Status | Protein (g/kg) |
|---|---|
| Normal (non-stressed, non-depleted) | 0.8 – 1.0 |
| Postoperative | 1.0 – 1.5 |
| Sepsis | 1.5 – 2.0 |
| Multiple trauma | 1.3 – 1.7 |
| Traumatic brain injury | 1.2 – 2.0 |
| Burns | 1.2 – 2.0 |
| Catabolism | 1.2 – 2.0 |
| Refeeding syndrome | 1.2 – 1.5 |
| Cancer | 0.8 – 2.0 |
| Hemodialysis | 1.1 – 1.2 |
| CCPD/CAPD | 1.2 – 1.3 |
| CRRT | 1.5 – 2.0 |
| Acute Renal Failure | 1.0 – 1.5 |
| Chronic Kidney Disease | 0.8 – 1.0 |
| Mild-Moderate Stress | 1.2 – 1.3 |
| Moderate-Severe Stress | 1.5 – 2.0 |
| Severe + Wound Healing | 1.5 – 2.0 |
| HIV (asymptomatic) | 1.0 – 1.4 |
| HIV (symptomatic) | 1.5 – 2.0 |
| HIV (CD4 < 200/AIDS defining condition) | 2.0 – 2.5 |
Fluid Requirements
The table below represents general guidelines for calculating fluid requirements. Consider your individual patient prior to determining the best method to use. Experience using these methods is helpful. You can calculate requirements using various methods and compare values.
| Based Upon | Method of Fluid Estimation |
|---|---|
| Weight |
|
| Energy | 1 mL per kcal |
| Age and weight |
|
| Fluid balance | Urine output + 500 mL/day |
Electrolyte Requirements
The table below represents general guidelines for electrolyte requirements, in consideration of clinical factors. Determination of the best method to use needs to be considered in the context of the individual and their current electrolyte status and bloodwork. This can vary tremendously based on the situation.
| Electrolyte | Daily Requirements | Factors That Increase Needs |
|---|---|---|
| Sodium | 1 – 2 mmol/kg | Diarrhea, vomiting, GI losses |
| Potassium | 1 – 2 mmol/kg | Diarrhea, vomiting, medications, refeeding syndrome, GI losses |
| Calcium | 5 – 7.5 mmol/day | High protein intake |
| Magnesium | 4 – 10 mmol/day | Medications, refeeding syndrome, GI losses |
| Phosphorous | 20 – 40 mmol/day | High dextrose loads, refeeding syndrome |
Sam’s Nutritional Requirements
Review Sam’s energy, protein, and fluid requirements.
For Sam’s energy requirements, it is important to try different predictive equations to compare.
66.5 + 13.75(65.9) + 5.0(186) − 6.78(42) = 1618 (REE) × 1.15 (AF: mobilizing infrequently) × 1.2 (SF: recent surgery, inflammation, and infection) = 2233 kcal/day
Regarding his activity factor: these are frequently overestimated. An AF of 1.15 is appropriate for an inpatient who is mobilizing occasionally around the ward. He is still fatigued, weak, deconditioned and is likely not getting up often to walk around.
Regarding the stress factor: an appropriate SF would be 1.0 – 1.2 because of his recent surgery, inflammation and infection. This could change with time and is why these requirements need to be frequently evaluated. In this case, the calculations reveal a range from 1980 to 2300 kcal/day. You can choose the average of these at 2300 kcal/day which provides 35 kcal/kg.
Sam’s energy requirements: ~2300 kcal/day (35 kcal/kg)
Protein requirements for Sam should range from 1.2 – 1.5 g/kg/day as he is post-operative and malnourished (physical signs of muscle wasting). Protein is also important in the context of his disease.
Finally, Sam’s fluid requirements are roughly 2300 mL/day, but keep in mind that Sam has a recent ileostomy meaning he is not using his colon. Fluid intake and hydration is of high importance meaning this will likely need to be adjusted.
Biochemical Data
Laboratory Values
| Laboratory Value | Normal Range |
|---|---|
| Glucose (Random) | 4.0 – 7.8 mmol/L |
| Sodium (Na+) | 135 – 145 mmol/L |
| Potassium (K+) | 3.5 – 5.0 mmol/L |
| Chloride (Cl–) | 96 – 106 mmol/L |
| Phosphorus (PO4) | 0.8 – 1.35 mmol/L |
| Calcium (Ca+2) | 2.1 – 2.7 mmol/L |
| Magnesium (Mg+2) | 0.63 – 0.94 mmol/L |
| Albumin (Alb) | 35 – 50 g/L |
| Blood Urea Nitrogen (BUN) | 3.0 – 7.0 mmol/L |
| Creatinine (Cr) | 44 – 80 μmol/L |
| Total Cholesterol | < 5.2 mmol/L |
Sam’s Biochemical Data: Lab Values
Review Sam’s lab values in the table below. The “Notes” column indicates which values are outside of target range and explains how to correct calcium and magnesium when albumin values are <35g/L.
| Laboratory Value | Sam’s Value | Notes |
|---|---|---|
| Glucose (Random) | 6.5 mmol/L | N/A |
| Sodium (Na+) | 135 mmol/L | N/A |
| Potassium (K+) | 3.8 mmol/L | N/A |
| Chloride (Cl–) | 102 mmol/L | N/A |
| Phosphorus (PO4) | 1.1 mmol/L | N/A |
| Calcium (Ca2+) | *1.9 mmol/L corrected = 2.24 mmol/L |
Outside the target range
Correct when albumin is <35 g/L Corrected calcium = Corrected calcium for Sam: |
| Magnesium (Mg2+) | 0.73 mmol/L corrected = 0.81 mmol/L |
Correct when albumin is <35g/L
Corrected magnesium = Corrected calcium for Sam: |
| Albumin (Alb) | *23 g/L | Outside the target range
Albumin is <35g/L, requiring corrections for calcium and magnesium. |
| Blood Urea Nitrogen (BUN) | *1.6 mmol/L | Outside the target range |
| Creatinine (Cr) | 56 μmol/L | N/A |
| Total Cholesterol | 3.3 mmol/L | N/A |
IV Solutions
Here is an overview of common IV solutions used in hospital. IV solutions contribute calories and other nutrients, so they need to be considered when you are creating a nutrition care plan.
| Solution | Kcal/L | Composition/L |
|---|---|---|
| Normal Saline (0.9% NaCl) | 0 | Na – 154 mmol
Cl – 154 mmol |
| ½ Normal Saline (0.45% NaCl) | 0 | Na -77 mmol
Cl – 77 mmol |
| D5W (5% Dextrose) | 170 | Dextrose – 50 g |
| D10W (10% Dextrose) | 340 | Dextrose – 100 g |
| 5% Dextrose and 0.9% NaCl | 170 | Dextrose – 50 g
Na – 154 mmol Cl – 154 mmol |
| ⅔ and ⅓ (3.3% Dextrose and 0.3% NaCl) | 112 | Dextrose – 33 g
Na – 51 mmol Cl – 51 mmol |
| Ringer’s Lactate | 9 | Na – 130 mmol
K – 4 mmol Ca2+ – 1.4 mmol Cl – 109 mmol Lactate – 28 mmol |
Dietary Data
Obtaining accurate dietary data can vary based on your patient (e.g. family members present, patient’s cognitive ability, flow sheets or calorie counts, etc.), as well as the setting (e.g. inpatient compared to outpatient).
If possible, collect the following information:
- Diet order(s): Important for a representation of daily intake while in the hospital (can include enteral nutrition & supplements).
- Dietary recall: 24 hr recall (if recent admission or representation of food consumption in hospital), common eating patterns, or short-term and long-term representation of eating patterns or typical foods.
- Calorie counts: Depending on the patient, you may order calorie counts to monitor/determine how much/ what they are eating in hospital.
Sam’s Dietary Data
Over the past 2 months, Sam’s diet consists mainly of fluids and small portion of bland foods (fruit, bread, rice, cereal) due to nausea, pain and loss of appetite.
Over the past 2 weeks (prior to hospital admission), Sam was not eating or drinking much due to feeling severely unwell, fatigued and having no appetite. Estimated caloric intake ~ 600 kcal per day.
Sam’s common foods or drinks:
- Two cans of vanilla Ensure® Plus per day
- Fruit juices, Gatorade, water, coffee, tea – reports drinking consistently throughout the day
Supplements: Vitamin D (1000 IU/day) and Calcium Carbonate (500 mg/day)
Current hospital diet order:
- Clear fluids (on day 1 tolerating and consuming ~800 mL of water and juice) — RD to consult for progression.
- Receiving IV ⅔ and ⅓ @ 100 cc/hour – provides 269 kcal/day and 122 mmol of Na and Cl
- Practice calculating this using the IV solutions table provided earlier
Assessment summary
Summary of Sam’s Assessment Data
Review the final summary for Sam’s assessment data. In practice, it is good to have a summary of this information with you at all times and to keep track of the progression of your patient.
| Area | Key Data |
|---|---|
| Clinical Data |
|
| Anthropometric and Physical Assessment Data |
|
| Nutrition Requirements Data |
|
| Biochemical Data |
|
| Dietary Data |
|
Common medical abbreviation for Latin "nil per os", meaning "nothing by mouth".
a bone at the top edge of the shoulder blade
The top of the pelvic bone, at the hip
The sacrum is a large triangular bone at the base of the spine, between the hip bones and above the tailbone.
