
Chapter 2 – Strategic Planning & The Marketing Environment
2.4 Strategic Portfolio Planning Approaches
LEARNING OBJECTIVE
- Explain how SBUs are evaluated using the Boston Consulting Group matrix.
When a company has multiple strategic business units like PepsiCo does, it must decide what the objectives and strategies for each business are and how to allocate resources among them. A group of businesses can be considered a portfolio, just as a collection of artwork or investments compose a portfolio. In order to evaluate each business, companies sometimes utilize what’s called a portfolio planning approach. A portfolio planning approach involves analyzing a company’s entire collection of businesses relative to one another. One of the many portfolio planning approaches includes the Boston Consulting Group (BCG) matrix.
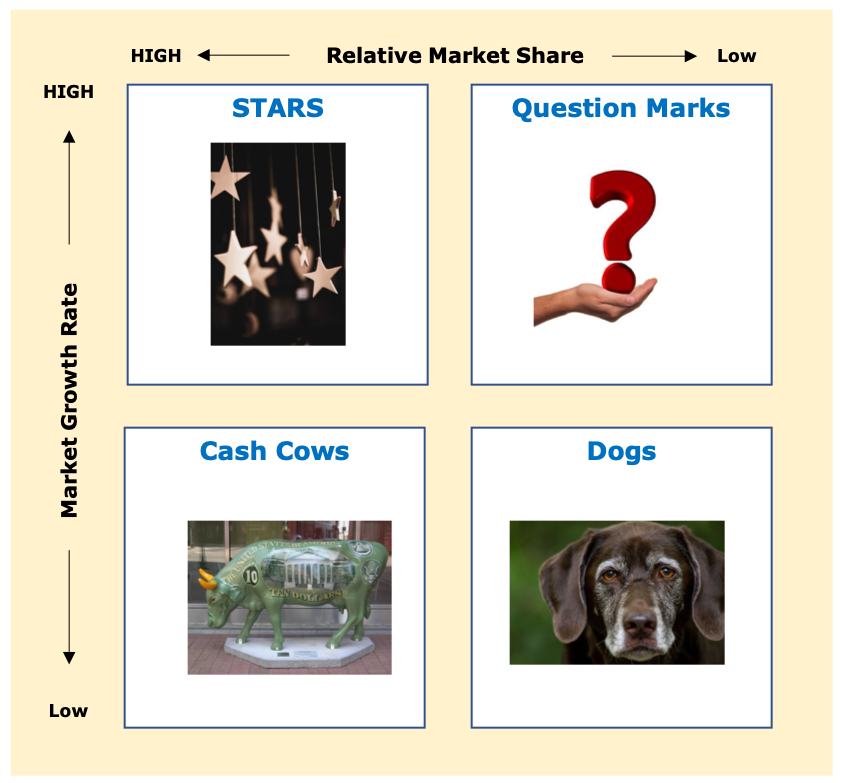
The Boston Consulting Group (BCG) matrix helps companies evaluate each of its strategic business units based on two factors: (1) the SBU’s market growth rate (i.e., how fast the unit is growing compared to the industry in which it competes) and (2) the SBU’s relative market share (i.e., how the unit’s share of the market compares to the market share of its competitors). Because the BCG matrix assumes that profitability and market share are highly related, it is a useful approach for making business and investment decisions. However, the BCG matrix is subjective and managers should also use their judgment and other planning approaches before making decisions. Using the BCG matrix, managers can categorize their SBUs (products) into one of four categories, as shown in Figure 2.10 “The Boston Consulting Group (BCG) Matrix”.
In evaluating each of the SBU’s, it is important to look at the market growth rate and relative market share for each business unit and then categorize each of them using the two by two matrix in figure 2.9. Market growth rate is the rate at which the market (the total revenues for the industry) will grow in the coming fiscal year. Relative Market share is the SBU’s market share divided by the market share of the SBU’s largest competitor. Using these two factors, you can know categorize them using the matrix. ‡
Stars
Everyone wants to be a star. A star is a product or SBU with high market growth rate and a high relative market share. For products or SBU’s that are categorized as stars, to maintain the growth of their star products, a company may have to invest money to improve them and how they are distributed as well as promote them. Generally, most companies choose to invest in their star products or SBU’s. The Apple watch is considered a star product because the overall market for smartwatches is expected to grow by 20.1% over the next seven year and Apples overall smartwatch relative market share is also high (they are the largest competitor) (Acumen Research and Consulting, 2021; Vailshery, 2021).
Cash Cows
A cash cow is a product with low market growth and a high relative market share. Cash cows have a large share of a shrinking market. Although they generate a lot of cash, they may not have a long-term future. For example, iPhones are a cash cow for Apple (Canalys, 2020). iPhones have a high relative market share and the smartphone market has a low overall market growth rate with a 1.1% growth rate recorded in Q4 2020 (IDC, 2021). Companies with cash cows need to manage them so that they continue to generate revenue to fund star products.
Question Marks
Question mark products are the hardest ones to determine if they will be successful or not. They often have low relative market share in a high growth rate market. Managers classify these products as question marks or problem children. They must decide whether to invest in them and hope they become stars or gradually eliminate or sell them as they become dogs. For example, the Amazon Fire tablet had a low relative market share (StatCounter, 2021) in a market that had an expected growth rate of 19.3% in 2020 (Vikhyaat, 2021).
Dogs
In business, it is not good to be considered a dog. A dog is a product with low market growth and low relative market share. Dogs do not make much money and do not have a promising future. Companies often get rid of dogs. However, some companies are hesitant to classify any of their products as dogs. As a result, they keep producing products and services they shouldn’t or invest in dogs in hopes they’ll succeed.
In conclusion, the BCG matrix helps managers make resource allocation decisions once different products are classified. Depending on the product, a company might decide on a number of different strategies for it. One strategy is to build market share for a business or product, especially a product that might become a star. Many companies invest in question marks because market share is available for them to capture. The success sequence is often used as a means to help question marks become stars. With the success sequence, money is taken from cash cows (if available) and invested into question marks in hopes of them becoming stars.
Holding market share means the company wants to keep the product’s share at the same level. When a company pursues this strategy, it only invests what it has to in order to maintain the product’s market share. When a company decides to harvest a product, the company lowers its investment in it. The goal is to try to generate short-term profits from the product regardless of the long-term impact on its survival. If a company decides to divest a product, the company drops or sells it. That’s what Procter & Gamble did in 2008 when it sold its Folgers coffee brand to Smuckers. Proctor & Gamble also sold Jif peanut butter brand to Smuckers. Many dogs are divested, but companies may also divest products because they want to focus on other brands they have in their portfolio.
As competitors enter the market, technology advances, and consumer preferences change, the position of a company’s products in the BCG matrix is also likely to change. The company has to continually evaluate the situation and adjust its investments and product promotion strategies accordingly. The company must also keep in mind that the BCG matrix is just one planning approach and that other variables can affect the success of products.
