
Chapter 3 – Consumer Behaviour: How People Make Buying Decisions
3.5 Formal and Informal Methods of Understanding the Customer
LEARNING OBJECTIVE
- To understand the formal and informal techniques used to understand customers.
There are a variety ways in which we can understand consumers. Steve Jobs said:
“Some people say give the customers what they want, but that’s not my approach. Our job is to figure out what they’re going to want before they do. I think Henry Ford once said, ‘If I’d ask customers what they wanted, they would’ve told me a faster horse.’ People don’t know what they want until you show it to them. That’s why I never rely on marketing research. Our task is to read things that are not yet on the page” (Smith, 2019).
However, Steve Jobs actually did do marketing research. He did it by reading, talking to people and informally observing the way people do things and having products built over and over until he had a product that he thought would do the job people wanted.
Most products and services fail in part because the companies involved didn’t take time to understand who their product or service was for, why that person or company might pay for or use the product or service, and how best to communicate the benefits of the product or service to them (Matthews, 2018).
In this section we will cover the formal marketing research process as well as what we will call the informal processes such as marketing intelligence and secondary research. However, the use of the term formal and informal doesn’t connate the importance of either, rather the degree to which the data collected can be depended on, projected to the total population under study and whether the information can be replicated. ‡
Many marketing problems and opportunities can be solved by gathering information from a company’s daily operations and analyzing it. Market intelligence involves gathering information on a regular, ongoing basis to stay in touch with what’s happening in the marketplace. Marketing research is what a company used if it can’t answer a question by using market intelligence, internal company data, social media data, or analytical software. Marketing research is the most controllable of the various sources of information. That is because marketing research is designed for the specific problem. The other sources are designed for other purposes. ‡
Marketing Research
Marketing research is what a company uses to answer specific questions. The name you should give your new product is an example. Unless your company has previously done some specific research on product names, what consumers think of them, good or bad, you’re probably not going to find the answer to that question in your internal company data. Also, unlike internal data, which is generated on a regular basis, marketing research is not ongoing. Marketing research is done on an as-needed or project basis. If an organization decides that it needs to conduct marketing research, it can either conduct marketing research itself or hire a marketing research company to do it.
So when is marketing research the right choice? The specific objectives of the research, whether sufficient data already exists, and the company needs to balance the cost of research against the revenue earned, or additional costs for making a wrong decision by not doing the research. Whether primary or secondary research, it takes time to collect and synthesize the information. If a quick decision is needed for a small problem, it might not be possible or necessary to do the research. Sometimes the answer is obvious to the company, so there is no point in conducting the research. If one of your competitors comes up with a new offering, you may be able to understand whether their product launch was successful by informally talking to their suppliers, or distributers.
Marketing research can help companies avoid making costly mistakes. When, Target entered Canada from the U.S, they assumed that the shoppers in the two countries were the same based on the Canadians who crossed the border to shop in U.S. Target stores. Unfortunately, Target failed to meet its profit objectives and closed its Canadian stores after only two years. There are many reasons why Target failed (Dahlhoff, 2015). However, marketing research and/or using available market intelligence would have improved the company’s chances of success. ‡
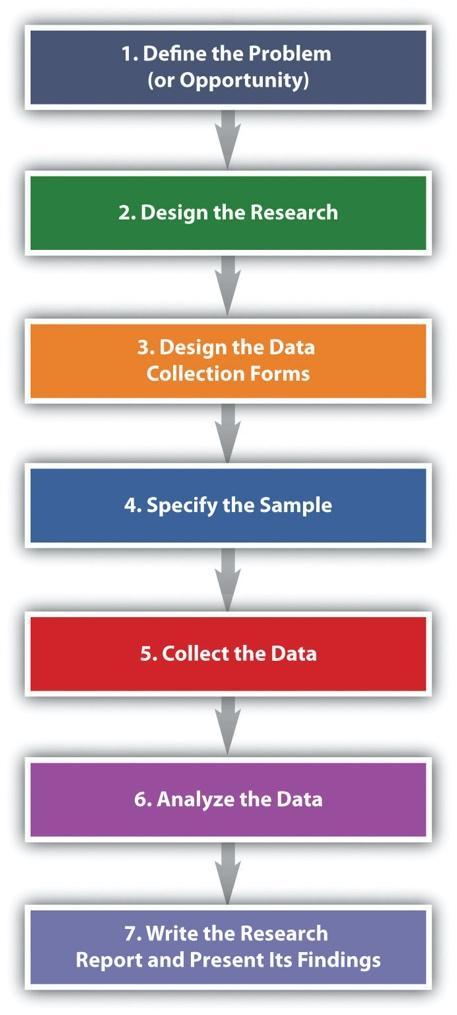
This image is from Principles of Marketing by University of Minnesota and is licensed under a Creative Commons Attribution-NonCommercial-ShareAlike 4.0 International License.
Step 1: Define the Problem (or Opportunity)
Defining the problem to be answered by the data from the research is the most critical part of the study. Suppose your product is tutoring other students in a subject in which you do well. You have been tutoring for a while, but suddenly, your business activity changes. Perhaps it drops off, or it explodes, and you can’t handle the number of students you’re being asked to tutor. If the business has exploded, should you try to expand your services? Perhaps you should subcontract with some other students. You could send them students to be tutored and you might negotiate a cut of their pay for each student you referred to them.
A decrease or increase in demand sounds like a problem but it is not the problem being referred in Step 1. An increase or decrease in demand is a symptom of a potential problem. For example, maybe your business has dropped off because your school is experiencing financial trouble and has lowered the number of scholarships given to incoming students. Consequently, there are fewer total students on campus who need your services. Conversely, if you’re swamped with people who want you to tutor them, perhaps your school awarded more scholarships than usual, so there are a greater number of students who need your services. Alternately, perhaps you ran an ad in your school’s newspaper, and that led to the increase in the number of students wanting you to tutor them.
Businesses face similar changes in demand as you do as a tutor. They might look at the symptoms, for example, decrease in sale or profit, for example, and try to understand the potential causes. If you decide to conduct your own research or approach a marketing research company you or the company will think through questions such as:
In what semester(s) did your tutoring revenues fall (or rise)?
In what subject areas did your tutoring revenues fall (or rise)?
In what sales channels did revenues fall (or rise): Were there fewer (or more) referrals from professors or other students? Did the ad you ran result in fewer (or more) referrals this month than in the past months?
Among what demographic groups did your revenues fall (or rise), women or men, people with certain majors, or first-year, second-, third-, or fourth-year students?
The key is to look at all potential causes in order to narrow the parameters of the study to the information you actually need to make a good decision about how to fix your business if revenues have dropped, or whether or not to expand it if your revenues have exploded.
The next task for the researcher is to put into writing the research objective. The research objective is the goal(s) the research is supposed to accomplish. The marketing research objective for your tutoring business might be to survey professors who teach the first year marketing course to determine why the number of students referred for tutoring dropped in the second semester.
Step 2: Design the Research
The next step in the marketing research process is to do a research design. It outlines what data you are going to gather and from whom, how and when you will collect the data, and how you will analyze it once it’s been obtained.
There are two basic types of data you can gather. The first is primary data. Primary data is information you collect yourself, using hands-on tools such as interviews or surveys, specifically for the research project you’re conducting. Secondary data is data that has already been collected by someone else, or data you have already collected for another purpose. Collecting primary data is the right way to go when you want greater control over the data collected to answer your problem. Before embarking on primary research, secondary research can be a great place to start. We will discuss secondary research as part of the marketing intelligence section. ‡
Primary Research
Types of Marketing Research Design
Research designs fall into one of the following three categories:
- Qualitative Research
- Quantitative Research
- Causal Research (experiments)
Qualitative Research
An exploratory research design is useful when you are investigating a problem but you would like to have more detail or a better understanding of the topic before conducting quantitative research. Perhaps on social media you noticed a potential new opportunity. You would then do exploratory research to investigate it further.
One form of exploratory research is qualitative research. Qualitative research is any form of research that explores consumers’ attitudes and behaviours through questions such as why rather than what or how much. Different forms, such as depth interviews and focus group interviews, are commonly used.
The depth interview, engaging in detailed, one-on-one, sessions with potential buyers, is an exploratory research technique. The moderators prepares a set of general topics, uses questions that are open ended, so that the participant follows their own thinking and provides lots of detail.
“How did you feel about the app after you downloaded the software?” is an example of a question that might be asked. A depth interview also allows a researcher to ask logical follow-up questions such as “Can you tell me what you mean when you say you felt uncomfortable about downloading it?”‡ or “Can you give me some examples?” to help dig further and shed additional light on the research problem. Depth interviews can be conducted in person, over the phone or online with the moderator taking notes or recording the interview.
Sometimes, you want to understand different points of view so your company decides to recruit a group of people to talk about the topic in which your company is interested. A focus group is a group of people who are brought together to discuss a marketing research topic with one another. They may be users, influencers, or buyers.‡ A moderator is used to focus the discussion, the sessions are recorded, and the main points of consensus are later summarized by the marketing researcher. For example, textbook publishers may gather groups of professors at educational conferences to participate in focus groups. As with depth interviews, focus groups can be conducted in person, over the phone or online.
The Basic Steps of Conducting a Focus Group
- Establish the objectives of the focus group. What is its purpose?
- Identify the people who will participate in the focus group. What makes them qualified to participate? How many of them will you need and what they will be paid?
- Obtain contact information for the participants and send out invitations (usually e-mails are most efficient).
- Develop a list of questions.
- Choose a moderator.
- Choose a location in which to hold the focus group, in person or online.
- Conduct the focus group. Almost always a focus group is audio or video recorded unless it done in store or at a location where recording is more difficult. If conducted online, using upgraded versions of Zoom will also provide a reasonable transcript from the recording. ‡
- Summarize the notes from the focus group and write a report.
Another useful technique is ethnography (in-person or online). In ethnographic research, researchers interview, observe, and often videotape people while doing day-to-day activities. The Walt Disney Company used ethnographers to uncover the likes and dislikes of boys aged six to fourteen, a financially attractive market segment for Disney, but one in which the company has been losing market share. The ethnographers visit the homes of boys, observe the things they have in their rooms to get a sense of their hobbies, and accompany them and their mothers when they shop to see where they go, what the boys are interested in, and what they ultimately buy (Barnes, 2009).
In some cases, your research questions may be sufficiently answered with exploratory research techniques. However, exploratory research is not sufficient to understand how the larger group of customers will think or behave. For other questions, you need to quantify the demand or understand from larger groups of customers, which reasons are more important to a majority of them, or the specific reasons why they will prefer, or buy your brand versus the competition.‡ Then quantitative research such as descriptive research or causal research is required.
Quantitative Research
Anything that can be observed or counted falls into the category of quantitative research. Descriptive research design involves gathering hard numbers, often via surveys, to describe or measure a phenomenon so as to answer the questions of who, what, where, when, and how. “On a scale of 1–5, how satisfied were you with your service?” is a question that illustrates the information a descriptive research design is supposed to capture.
Descriptive research, for example, can tell you how many of, and how satisfied your customers are. It is not as effective at telling you in detail why, even if you use open-ended questions. That’s because quantitative research depends on standardizing the questions and answers so that each participant receives the same information.‡ Open-ended questions on a quantitative survey can be done but are not considered projectable to the total customer group and are not a complete substitute for qualitative or causal research design (Wagner, 2007).
Causal Research
Causal research design examines cause-and-effect relationships. Using a causal research design allows researchers to answer “what if” types of questions. For example, if a company changes X (say, a product’s price, design, placement, or advertising), what will happen to Y (say, sales or customer loyalty)? The researcher designs an experiment that “controls,” or holds constant, all of a product’s marketing elements except one (or using advanced techniques of research, a few elements can be studied at the same time). One variable is changed, and the effect is measured. Sometimes the experiments are conducted in a laboratory using a simulated setting designed to replicate the conditions buyers would experience. Or the experiments may be conducted in a virtual computer setting. Due to the availability of online software, companies are using causal research more often.
An experiment conducted in a natural setting such as a store is referred to as a field experiment or test market. Companies sometimes do test markets either because it is more convenient or because they want to see if buyers will behave the same way in the “real world” as in a laboratory or on a computer. Before a large company rolls out a product to the entire marketplace, it will often place the offering in a test market to see how well it will be received. Due to their cost and that the company is exposing a new product to their competition, companies make only use a test market when the risks of failure is high and they have few competitors who can copy the product.
Step 3: Design the Data-Collection Forms
There are many different types of data collection forms. The range from a discussion guide used in a depth interview or focus group to a structured questionnaire in quantitative research to code book in content analysis or an observer form in ethnographic research. Questionnaires are used when surveying people. Since they are widely used we discuss them in a little more detail.
Questionnaire Design
To produce the best results, survey questionnaires needs to be carefully designed. If the behaviour of buyers is being formally observed, , the data need to be recorded on a standardized data-collection form that is likely to be digital. Asking the same questions with pre-set answers ensures that the data collected will be comparable.‡ Most questionnaires follow a similar format. They begin with an introduction describing the study. That is followed by instructions for completing the questionnaire and, how to submit it. The first few questions that appear on the questionnaire are usually basic, warm-up type of questions the respondent can readily answer, such as product usage or easy to answer questions. The warm-up questions are then followed by a logical progression of more detailed, in-depth questions that get to the heart of the question being researched. Questions such as the respondent’s age, level of education, place of residence should be put at the end of the questionnaire. The questionnaire often ends with thanking the respondent for participating in the survey. ‡
How the questions are worded is extremely important. Care needs to be taken that the survey questions are written in an unbiased, neutral way. In other words, they shouldn’t lead a person taking the questionnaire to answer a question one way or another by virtue of the way they are worded. The following is an example of a leading question:
Don’t you agree that students deserve an A grade in every course?
The questions also need to be clear and unambiguous. Consider the following question:
Which brand of toothpaste do you use?
The question sounds clear enough, but is it really? What if the respondent recently switched brands? What if she uses Crest at home, but while away from home or traveling, she uses Colgate’s Wisp portable toothpaste-and-brush product? How will the respondent answer the question? Rewording the question as follows so it’s more specific will help make the question clearer:
Which brand of toothpaste have you used at home in the past six months? If you have used more than one brand, please list each of them.
Multiple-choice and yes-and-no questions are examples of closed-ended questions. Open-ended questions, or questions that ask respondents to write in their own answers can be included. However, they are harder to tabulate than closed-ended questions.
If you are interested in learning more about how to design an effective questionnaire refer to the article “Designing a Questionnaire that Dives Beneath the Surface”. ‡
Step 4: Specify the Sample
Once you have created your questionnaire or other marketing study, you select a sample or subset of potential buyers or users in the market. First, you must define your population of, for example current or potential customers. The next step is to put together the sampling frame, which is the list from which the sample is drawn. The sampling frame can be put together using for example, customer lists (Wrenn et. al., 2007). Keep in mind that the sampling frame won’t exactly match the population. Some people will be included on the list who shouldn’t be and some who should be included, may be omitted. Think about if you were to conduct a survey of, say, 25 percent of your friends, using their numbers in cell phone. You may have all of your friends in your phone, but some of their phone numbers might have changed or be out of service. Therefore a certain amount of sampling error is to be expected.
For example, if a grocery store needs to quickly conduct some research on shoppers to get ready for an upcoming promotion, they need to make sure that all shoppers are represented. They need to consider those who shop at the store before and after work as well as those who visit during the day. What about people who work a night shift?
Lastly, the size of the sample has an effect on the amount of sampling error. Larger samples generally produce more accurate results. The larger your sample is, the more data you will have, which will give you a more complete picture of what you’re studying. Statistics is used to determine a sample’s optimal size. If you take a marketing research or statistics class, you will learn more about how to determine the optimal size.
Step 5: Collect the Data
Data can be collected in a number of ways including surveys, taking physical measurements, and observing people. Survey data can be collected using many methods. Online and mobile surveys are the most commonly used. In-person, telephone and mail methods are less used because they are more expensive however, they provide more reliable data. ‡
Regardless of the methods, if people are aware that a company is collecting data, it may have an effect on their answers or their behaviour. For example, a customer has several bags of chips in their shopping cart but realizing she is being observed, out of embarrassment she may decide to put some of the bags back before getting to the checkout station. To get around problems such as these, some companies set up less visible cameras to observe customers. Note using cameras can raise privacy issues in Canada so companies must be careful to indicate to customers and employees that they are being recorded. Similarly Facebook observes your behaviour not only on their website but across many other websites you visit by using cookies and agreements with software app providers. ‡
Step 6: Analyze the Data
Step 6 involves cleaning, exploring and organizing the data to understand what customers told you. ‡ Once all the data is collected, the researchers begin the data cleaning, which is the process of removing data that have accidentally been duplicated (entered twice into the computer) or correcting data that have obviously been recorded wrong. Programs such as Microsoft Excel or IBM SPSS can be used to tabulate quantitative data, as well as graphical presentations of the data.
Quantitative data can be used to draw conclusions. For example what a proportion of the study participants liked or didn’t like about an offering can be used to anticipate what the larger target group will like or dislike. Data can also be used to spot differences between groups of people. For example, the research might show that people in one area of the country like the product better than people in another area.
Part of analyzing quantitative data is to see if it seems sound. You can’t do the same sort of analysis on qualitative data. Are the conclusions that become apparent from it reasonable? Generally, researchers will report on the validity and reliability of the data. The data is valid if it actually tested what it was designed to test. If you were to repeat the study, and get similar results, the data is said to be reliable. The data collected can also be compared to data from other sources to see if is the conclusions are consistent across different sources.
Step 7: Write the Research Report and Present Its Findings
Whether the research is conducted internally by the company, or with the help of an external research company, it is important to write a report and to create a centralized place to house the reports. This creates an archive of the ideas that a company has investigated and allows for repeated data collection across time for the same research question to show changes or progress.
There are many ways to write up a report but traditionally a research report has the following elements: ‡
- Title Page explains what the report is about, when it was conducted and by whom, and who requested it.
- Table of Contents outlines the major parts of the report, as well as any graphs and charts, and the page numbers on which they can be found.
- Executive Summary summarizes all findings and recommendations of the research. Many people who receive the report may not have time to read the entire report. Instead, they will rely on the executive summary to get an idea of the key results and recommendations.
- Methodology and Limitations section of the report explains the technical details of how the research was designed and conducted. The section explains how the data was collected and by whom, the size of the sample, how it was chosen, and whom or what it consisted of (e.g., the number of women versus men or children versus adults). It also includes information about the statistical techniques used to analyze the data. Every study has errors; sampling errors, interviewer errors, and so forth. The methodology section should explain these details, so decision makers can consider their overall impact.
- Findings section is a longer, more detailed version of the executive summary that goes into more detail about the data uncovered by the research that support the study’s findings.
- Recommendations section should state what should be done as a result of the research.‡
Sources of Secondary Data
In addition to the company’s internal information available, external information is also critical to making good decisions. For example, what is the business environment like? Are credit-lending terms loose or tight, and how will they affect what you and your customers are able to buy or not buy? How will rising fuel prices and alternate energy sources affect your company and your products? Do changes in the environment present business obstacles or opportunities? How are your competitors behaving? Online comments and reviews add to the array of data available to a company.
Libraries are a good place to gather free secondary data. They have searchable databases as well as handbooks, dictionaries, and books, some of which you can access online. Government agencies also collect and report information on demographics, economic and employment data, health information, and balance-of-trade statistics, among a lot of other information. In Canada, several federal government departments collect and provide information on Canada. Statistics Canada, Industry, Canadian Radio and Television Commission publish reports and databases with data that can be manipulated to answer your research questions.
https://www.statcan.gc.ca/eng/start
https://crtc.gc.ca/eng/home-accueil.htm
In addition, you can check the list of government departments with available information:
https://www.canada.ca/en/government/dept.html
Industry associations and trade publications often provide free information to non-members. Some of the information that is locked can also be accessed through a university, college or public library. The Canadian government has created a list of major industry association in Canada so this is a good place to start.
Here are a few others that publish research that may be of interest to marketing professional.
https://www.nationalgrocers.org/
https://www.careersinfood.com/canadian-food-and-beverage-trade-associations-resource-73.htm‡
When you are gathering secondary information, you should answer the following questions before your using the data in the reports or dataset:
- Who gathered this information?
- For what purpose?
- What does the person or private or public sector organization that gathered the information have to gain by doing so?
- Was the information gathered and reported in a systematic manner?
- Is the source of the information accepted as an authority by other experts in the field?
- Does the article provide objective evidence to support the position presented?
Marketing Intelligence Systems
Marketing information is being gathered all the time by companies as they engage in their daily operations. When a sale is made and recorded whether on the company’s website or at a retail store, this is useful marketing information. When a sales representative records the shipping preferences of a customer in a company’s customer relationship management (CRM) system, this is useful information. When a company gets a customer complaint and records it, that’s useful. All this data can be used to generate consumer insight.
In addition, other information can be collected that indirectly tells the company what transactional data and customer surveys may not indicated. For example, many companies track the return rates on products or cancellation of services. Research has categorized returns as controllable and uncontrollable. The information provides a timely understanding of the quality, appeal and utility of the products and services, to understand, for example, whether to restock the items, to continue a relationship with the company providing the product or service and for retailers, think about creating their own private label products. The Bay, a department store retailer, minimizes the number and cost of product returns because the wrong size was ordered by offering a feature on their website called True Fit. It asks the customers to answer a few questions to determine the best fit, size and style for them. True Fit has built a database from customer data, garment specifications, style attributes about products and transactional data brands and retailer partners (True Fit, n.d.).‡
Integrating all the information you collect so that it can be used by as many people as possible is critical to making good decisions. A marketing information system (MIS) is a way to manage the vast amount of information companies have and could be used to make decisions.
