Chapter 6
6.2 Second Order Overdamped Systems
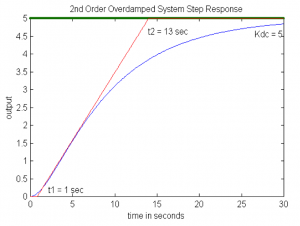
Consider a second order system described by the transfer function in Equation 6‑4. where transfer function G(s) has two real poles and no zeros. Its unit step response can be derived using partial fractions and is shown in Equation 6‑5. Its step response is shown in Figure 6‑2.

| [latex]G(s) = \frac{K}{S^{2} + as + b} = \frac{K}{(s+p_{1})(s+p_{2})} = \frac{K_{dc}}{(s\tau_{1} + 1)(s\tau_{2} + 1)}[/latex] | Equation 6‑4 |
| [latex]y(t) = (K_{dc} + K_{1}e^{-p_{1}t} + K_{2}e^{-p_{2}t}) \cdot 1(t)[/latex] | Equation 6‑5 |
Note that:
| [latex]G(s) = \frac{K}{s^2 +as+b}[/latex] | [latex]L \left ( \frac{dy}{dt} \right )=s\cdot Y(s) =\frac{K}{s^2+as+b}[/latex] | |
| [latex]Y(s)=\frac{1}{s}\cdot G(s)=\frac{1}{s}\cdot\frac{K}{s^2+as+b}[/latex] | [latex]\lim_{t\rightarrow0}\left (\frac{dy}{dt} \right )=\lim_{s\rightarrow\infty}s\cdot\left(\frac{K}{s^2+as+b} \right ) = 0[/latex] | Equation 6‑5 |
If the unit step input is used, the process DC gain can be evaluated directly from the graph, in the same manner as we did for the first order system. However, unlike in the first order system case, the two Time Constants cannot be found directly from the plot. For a second order (and higher orders as well) system, the derivative of the step response at t = 0 is equal to zero. This means that the step response is “S-shaped” towards t = 0. The closer the two Time Constants are, the more pronounced “S-shape”. If [latex]\tau_{1}<<\tau_{2}[/latex] , the response may resemble more the first order system response. If the “S-shape“ is visible, the two Time Constants may be “guesstimated” as shown in Figure 6‑2. The Time Constants can then be iterated by simulation, through having the model response plot adjusted for the “best fit” with the measured response.
6.2.1 Example
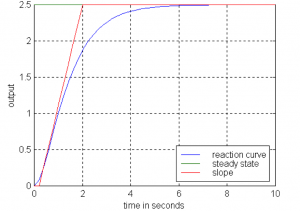
Consider a plot showing a response of a certain unknown process to a normalized unit step input. Derive an appropriate transfer function model for this process.


