Chapter 9
9.5 PID Controller and Its Tuning
PID Controllers yield themselves to simple, empirical (i.e. experimental) adjustments in order to achieve a satisfactory response. Let’s consider again the example from Chapter 9.2, where G(s) was described as:
[latex]G(s)=\frac{2}{s^2+5s+2}\cdot\frac{5}{s^2+10s+2}[/latex]
Assume the closed loop system has a PID Control implemented. Replace the Proportional Controller in Figure 9‑9 with the PID Controller in its Series Configuration, described by the following transfer function:
| [latex]G_{PID}(s)=K_p\cdot\left(\frac{K_i}{s} + 1 \right )\cdot(K_d s +1)[/latex] or | |
| [latex]G_{PID}(s)=K_p\cdot\left(\frac{1}{\tau_i s} + 1 \right )\cdot(\tau_d s +1)[/latex] | Equation 9-11 |
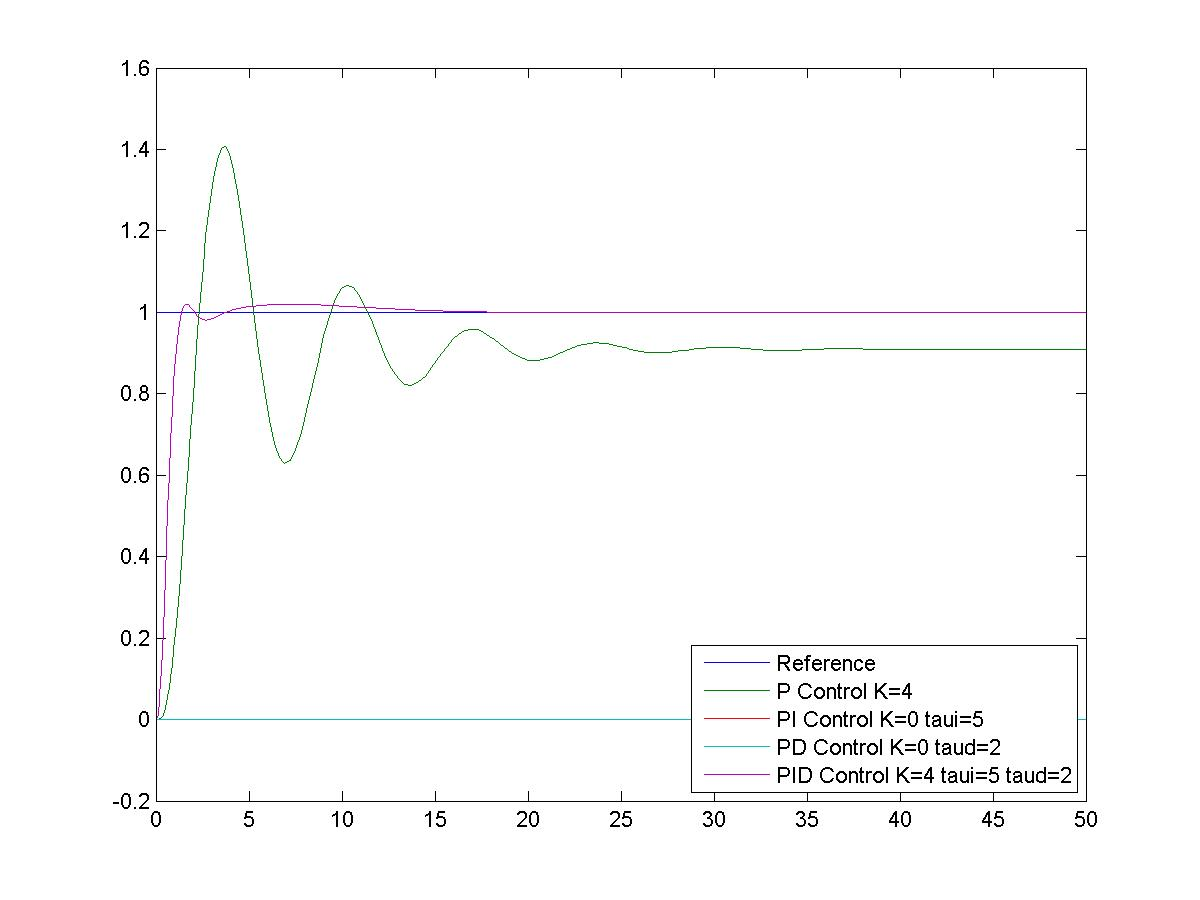
The adjustable variables in the PID Controller are represented either by the Proportional Gain, [latex]K_p[/latex], Integral Gain, [latex]K_i[/latex], and the Derivative Gain, [latex]K_d[/latex], or by the Proportional Gain, [latex]K_p[/latex], the Integral Time Constant, [latex]\tau_i[/latex], and the Derivative Time Constant, [latex]\tau_d[/latex]. Note that [latex]\tau_i = \frac{1}{K_i}[/latex]. Let’s assume the value of the Derivative Gain (or Derivative Time Constant [latex]\tau_d =2[/latex] seconds) and the value of the Integral Time Constant [latex]\tau_i = 5[/latex] seconds ((or Integral Gain [latex]K_i = 0.2[/latex]). The closed loop system transfer function of this system under PID Control is shown in Equation 9‑12.
| [latex]G_{clPID}(s)=\frac{K_p\left(1+\frac{K_i}{s} \right )(K_d s +1)G(s)}{1+K_p\left(1+\frac{K_i}{s} \right )(K_d s +1)G(s)}[/latex] | |
| [latex]G_{clPID}(s)=\frac{10K_p (s+K_i)(K_d s +1)}{s^5 + 15s^4 +54s^3+(30+10K_p K_d)s^2 + (4+10K_p + 10K_p K_i K_d)s + 10 K_p K_i}[/latex] | Equation 9-12 |
The critical gain can be calculated from the Routh-Hurwitz Criterion as [latex]K_{crit} = 33.61[/latex] and the resulting frequency of marginal oscillations is calculated as [latex]\omega_{osc} = 6.83[/latex] rad/sec.
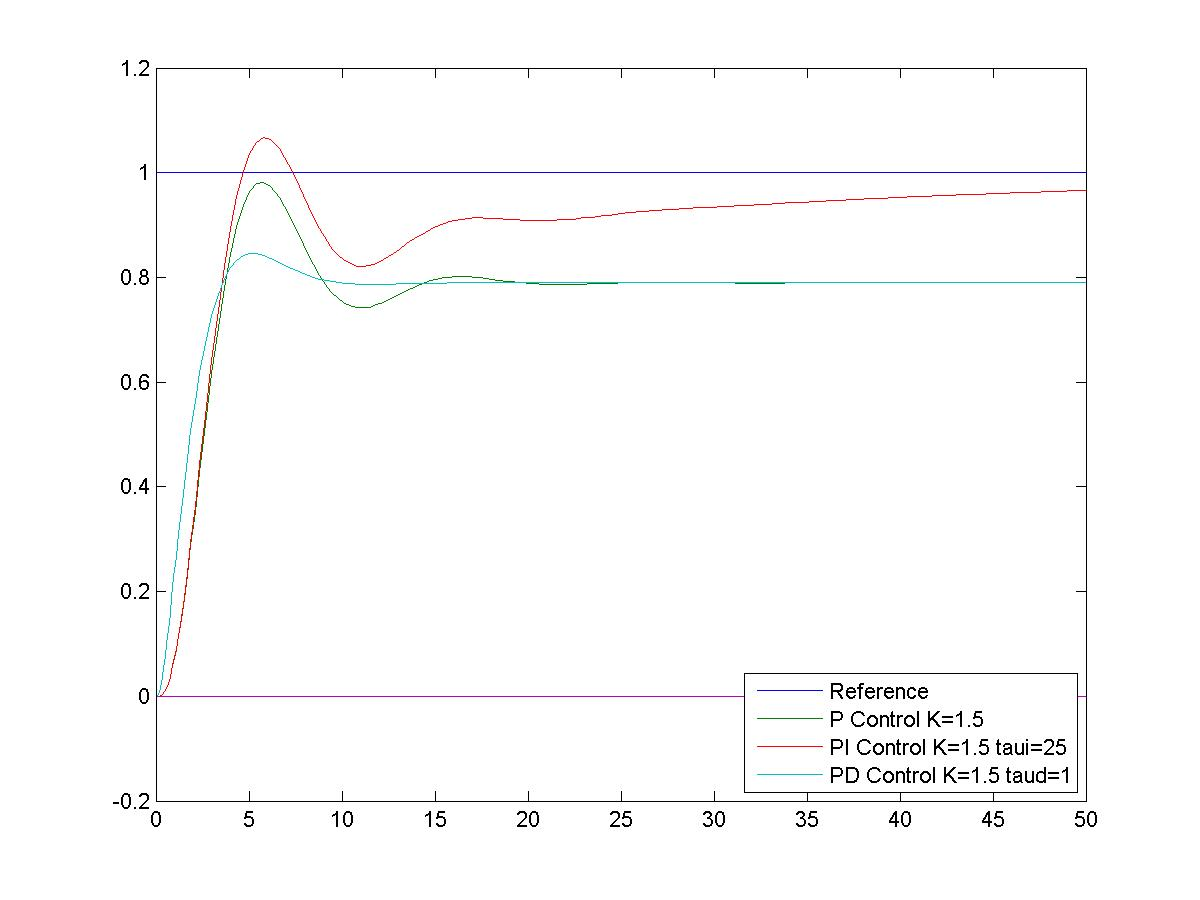
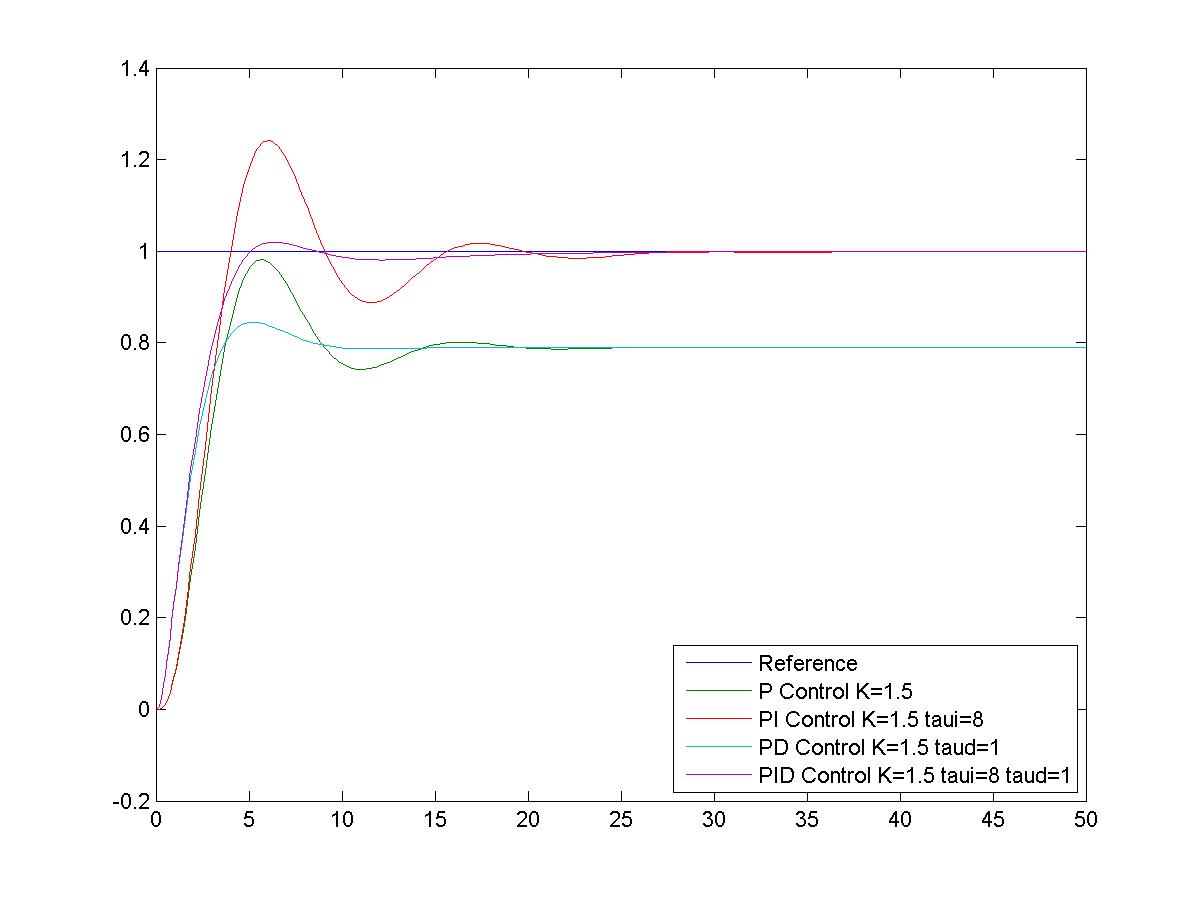
Figure 9‑24 and Figure 9‑25 show P, PI, PD and PID modes comparisons for this Example. Figure 9‑26 shows the closed loop response of this system under a well-tuned PID Controller. The PID structure increases the System Type by one due to the presence of Integrator in the controller, and also introduces two closed loop zeros. The net effect, as can be seen in Figure 9‑26, is that both the steady state tracking and the transient response are improved.
The specs achieved by using an empirically tuned PID Controller will not be optimal (i.e. mathematically best given a set of criteria), but usually satisfactory in an industrial environment. This flexibility and ease of use are two of the reasons for PID’s continuing popularity. There are many sophisticated controller design methods such as pole placement via multiple state feedback, optimal control, Kalman filter design, adaptive reference model control, etc., but they all require an in-depth knowledge of a fairly difficult theoretical background in order to be used effectively.


In contrast, PID setting adjustments, i.e. tuning, can be done almost intuitively, using simple sets of rules – the so-called tuning methods such as Ziegler-Nichols tuning. It is done best when combined with a basic understanding of Root Locus rules and of relative stability concepts – Gain Margin. For more information on PID tuning, read the Appendix to Lab 2 instructions.
9.5.1 PID Controller in Presence of Noise
As discussed previously, Derivative Control increases the system bandwidth, due to the presence of a zero, thus reducing noise attenuation. This effect is even stronger in the PID Controller, since this controller has two zeros. If the system is to work in a noisy environment, this may result in unsatisfactory noise attenuation. As previously discussed, the Rate Feedback term may be used to replace the Derivative term. When this is not sufficient, another option is to replace the Derivative term with the so-called Lead Compensator (Controller). We will discuss Lead Compensation in more detail in the following chapters. The modified Controller transfer function is shown in Equation 9‑13.
| [latex]G_c(s)=K_p\left(1+\frac{1}{\tau_i s} \right )\cdot\frac{1+\tau_d s}{1+\alpha\tau_d s}[/latex] | [latex]0<\alpha<1[/latex] | Equation 9-13 |
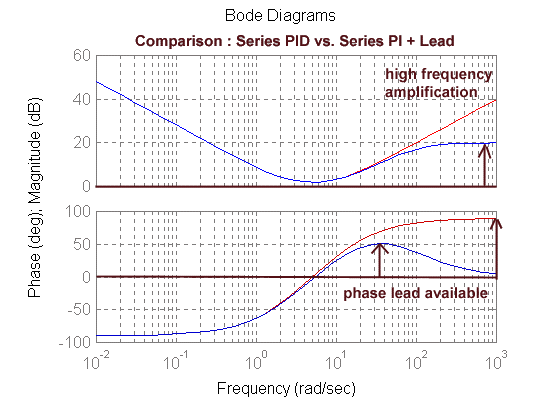
As Figure 9‑27 shows, when the PD term is replaced with a lead component [latex](\alpha<1)[/latex] the zero of the lead component is smaller than the pole, and as a result, the magnitude slope initially goes up but then levels off. On the phase characteristic, the PD term adds [latex]+90^{\circ}[/latex] phase as frequency [latex]\rightarrow \infty[/latex]. With the lead component, while the phase characteristic initially increases, it too levels off. The effectiveness of the Derivative action is reduced, but it does help maintain the required noise attenuation at high frequencies.


